As part of a recent project involving advanced sound cards, Bootlin engineer Miquèl Raynal had to find a way to automate audio hardware loopback testing. In hand, he had a PCI audio device with many external interfaces, each of them featuring an XLR connector. The connectors were wired to analog and digital inputs and outputs. In a regular sound-engineers based company, playing back heavy music through amplifiers and loud speakers is probably the norm, but in order to prevent his colleagues ears from bleeding during his ALSA/DMA debug sessions, he decided to anticipate all human issues and save himself from any whining coming from his nearby colleagues.
Author: Miquèl Raynal
A journey in the RTC subsystem
As part of a team effort to improve the upstream Linux kernel support for the Renesas RZ/N1 ARM processor, we had to write from scratch a new RTC driver for this SoC. The RTC subsystem API is rather straightforward but, as most kernel subsystems, the documentation about it is rather sparse. So what are the steps to write a basic RTC driver? Here are some pointers.
The registration
The core expects drivers to allocate, initialize and then register a struct rtc_device
with the device managed helpers: devm_rtc_allocate_device()
and devm_rtc_register_device()
. Between these two function calls, one will be required to provide at least a set of struct rtc_class_ops
which contains the various callbacks used to access the device from the core, as well as setting a few information about the device.
The kind of information expected is the support for various features (rtcdev->features
bitmap) as well as the maximum continuous time range supported by your RTC. If you do not know the actual date after which your device stops being reliable, you can use the rtc-range
test tool from rtc-tools
, available at https://git.kernel.org/pub/scm/linux/kernel/git/abelloni/rtc-tools.git (also available as a Buildroot package). It will check the consistency of your driver against a number of common known-to-be-failing situations.
Time handling
The most basic operations to provide are ->read_time()
and ->set_time()
. Both functions should play with a struct rtc_time
which describes time and date with members for the year, month, day of the month, hours (in 24-hour mode), minutes and seconds. The week day member is ignored by userspace and is not expected to be set properly, unless it is actively used by the RTC, for example to set alarms. There are then three popular ways of storing time in the RTC world:
- either using the binary values of each of these fields
- or using a Binary Coded Decimal (BCD) version of these fields
- or, finally, by storing a timestamp in seconds since the epoch
In BCD, each decimal digit is encoded using four bits, eg. the number 12 could either be coded by 0x0C in hexadecimal, or 0x12 in BCD, which is easier to read with a human eye.
The three representations are absolutely equivalent and you are free to convert the time from one system to another when needed:
- #1 <-> #2 conversions are done with
bcd2bin()
andbin2bcd()
(fromlinux/bcd.h
) - #1 <-> #3 conversions are done with
rtc_time64_to_tm()
andrtc_tm_to_time64()
(fromlinux/rtc.h
)
While debugging, it is likely that you will end up dumping these time structures. Note that struct rtc_time
is aligned on struct tm
, this means that the year field is the number of years since 1900 and the month field is the number of months since January, in the range 0 to 11. Anyway, dumping these fields manually is a loss of time, it is advised instead to use the dedicated RTC printk specifiers which will handle the conversion for you: %ptR
for a struct rtc_time
, %ptT
for a time64_t
.
Of course, when reading the actual time from multiple registers on the device and filling those fields, be aware that you should handle possible wrapping situations. Either the device has an internal latching mechanism for that (eg. the front-end of the registers that you must read are all frozen upon a specific action) or you need to verify this manually by, for instance, monitoring the seconds register and try another read if it changed between the beginning and the end of the retrieval.
If your device continuous time range ended before 2000 you may want to shift the default hardware range further by providing the start-year
device tree property. The core will then shift the Epoch further for you.
Finally, once done, you can verify your implementation by playing with the rtc
test tool (also from rtc-tools
).
Supporting alarms
One common RTC feature is the ability to trigger alarms at specific times. Of course it’s even better if your RTC can wake-up the system.
If the device or the way it is integrated doesn’t support alarms, this should be advertised at registration time by clearing the relevant bit (RTC_FEATURE_ALARM
, RTC_FEATURE_UPDATE_INTERRUPT
). In the other situations, it is relevant to indicate whether the RTC has a second, 2-seconds or minute resolution by setting the appropriate flag (RTC_FEATURE_ALARM_RES_2S
, RTC_FEATURE_ALARM_RES_MINUTE
). Mind when testing that querying an alarm time below this resolution will return a -ETIME
error.
When implementing the ->read_alarm()
, ->set_alarm()
and ->alarm_irq_enable()
hooks, be aware that the update and periodic alarms are now implemented in the core, using HR timers rather than with the RTC so you should focus on the regular alarm. The read/set hooks naturally allow to read and change the alarm settings. A struct rtc_wkalrm *alrm
is passed as parameter, alrm->time
is the struct rtc_time
and alrm->enabled
the state of the alarm (which must be set in ->set_alarm()
). The third hook is an asynchronous way to enable/disable the alarm IRQ.
The interrupt handler for the alarm is required to call rtc_update_irq()
to signal the core that an alarm happened, providing the RTC device, the number of alarms reported (usually one), and the RTC_IRQF
flag OR’ed with the relevant alarm flag (likely, RTC_AF
for the main alarm).
Oscillator offset compensation
RTC counters rely on very precise clock sources to deliver accurate times. To handle the situation where the source is not matching the expected precision, which is the case with most cheap oscillators on the market, some RTCs have a mechanism allowing to compensate for the frequency variation by incrementing or skipping the RTC counters at a regular interval in order to get closer to the reality.
The RTC subsystem offers a set of callbacks, ->read_offset()
and a ->set_offset()
, where a signed offset is passed in ppb (parts per billion).
As an example, if an oscillator is below its targeted frequency of 32768 Hz and is measured to run at 32767.7 Hz, we need to offset the counter by 1 - (32767.7/32768) = 9155 ppb
. If the RTC is capable of offsetting the main counter once every 20s it means that every 20s, this counter (which gets decremented at the frequency of the oscillator to produce the “seconds”) will start at a different value than 32768. Adding 1 to this counter every 20s would basically mean earning 1 / (32768 * 20) = 1526 ppb
. Our target being 9155 ppb, we must offset the counter by 9155 / 1526 = 6
every 20s to get a compensated rate of 32767.7 + (6 / 20) = 32768 Hz
.
Upstreaming status of the RZ/N1 RTC driver
The RZ/N1 RTC driver has all the features listed above and made its way into the v5.18 Linux kernel release. Hopefully this little reference sheet will encourage others to finalize and send new RTC drivers upstream!
The backbone of a Linux Industrial I/O driver
As part of recent projects, we had to dig into the Linux kernel Industrial I/O (IIO) subsystem with the goals of supporting a new ADC and adding new features to an existing driver. These tasks involved quite a few discussions between our engineering team and the IIO maintainers and reviewers. The aim of this blog post is to summarize the substance of these explanations to help others understand how an IIO kernel driver works and interacts with the core IIO subsystem.
Disclaimer: The IIO core is huge and keeps evolving. The aim of this article is not to cover it entirely, but at least explain our knowledge of how to use its basic features for common situations.
What is IIO?
The Industrial I/O subsystem covers any type of device that is commonly called as a “sensor”: ADCs, IMUs, temperature sensors, accelerometers, pressure sensors, potentiometers, light sensors, proximity sensors, etc (as well as few actuators, which I will on purpose disregard in this blog post). All these devices, besides measuring truly different physical components of our three dimensional world, end-up sharing quite a few properties. Any of these sensors must first be configured in order to know what must be measured and possibly how. When adequate, the device must be triggered in order to start converting. When the requested samples are ready, there must be some kind of signaling involved in order for the user to retrieve and process the data.
When thinking about the generic interfaces which could be needed by all these devices, it is quite straightforward to list:
- The configuration before sampling
- The triggering mechanism
- The signaling for an end of conversion situation
- The reading of the samples
- The advertisement of the data
Registering an IIO device
The IIO core manipulates struct iio_dev *
objects which inherits from struct device
. This object should be allocated by the device driver with devm_iio_device_alloc()
, providing the size of the driver’s internal structure as second argument. The allocated area dedicated for this internal pointer can be then retrieved with iio_priv()
.
This iio_dev
structure must then be filled with a number of information:
- The name of the device
- A set of
struct iio_info
operations, typically a hook to read one or multiple samples on demand, optionally be able to write to the device, etc. - A set of supported modes, such as
INDIO_DIRECT_MODE
, which is used when samples can be retrieved at any time by the user from sysfs. - A scan mask, namely
available_scan_masks
which defines what are the possible/impossible scan combinations when requesting a read. Typically, a device might be configured to scan all of its internal channels from 1 to N. This can be described with a list ofGENMASK(X, 0)
, with X ranging from 0 to the maximum number of channels. When the user will request a given set of channels, the IIO core will go through all the available masks registered by the driver and pick the first one that contains the desired channels. The selected mask will be available to the driver through theactive_scan_mask
entry of theiio_dev
structure. If ‘anything goes’ and the devices has no restriction regarding which channel(s) can be scanned, this field should be skipped. - A definition of all the possible channels, including the type of physical measurements the device is able to perform (
IIO_VOLTAGE
,IIO_CURRENT
,IIO_TEMPERATURE
,IIO_STEPS
,IIO_ROT
, etc), the channel index and the data format.
Here is an example of channel description and below the meaning of these fields.
struct iio_chan_spec chan1 = { .type = IIO_VOLTAGE, .indexed = 0, .channel = index, .info_mask_separate = BIT(IIO_CHAN_INFO_RAW), .info_mask_shared_by_type = BIT(IIO_CHAN_INFO_SCALE), .scan_index = 1, .scan_type = { .sign = 'u', .realbits = 10, .storagebits = 16, .shift = 2, .endianness = IIO_BE, }, }
.info_mask_separate
indicates an entry in sysfs that will be present for all the channels.IIO_CHAN_INFO_RAW
is the raw value of the sample..info_mask_shared_by_type
indicates an entry in sysfs that will be sorted by the type.IIO_CHAN_INFO_SCALE
means that there will be a common voltage scale sysfs entry shared by all the voltage raw entries. If the device was also able to read a temperature, we would also get a single file indicating the scale for all the temperature samples.- The
.scan_type
field in the example indicates that values are provided as 16-bit big-endian samples that must be shifted by two bits. The full scale range is 0-1023. This conversion only applies to the buffer reading path: raw values directly read from sysfs and returned by the->read_raw()
hook (see below) should be converted by the driver itself.
Once the device fully described (and initialized, of course), the driver must register it with devm_iio_device_register()
.
Scaling factors
The int (*read_raw)(struct iio_dev *indio_dev, struct iio_chan_spec const *chan, int *val, int *val2, long mask)
callback will be executed when reading either of the ‘raw value’ or ‘scale’ files from sysfs.
The type of data that must be returned is provided in the mask parameter: IIO_CHAN_INFO_RAW
to retrieve the raw measurement or IIO_CHAN_INFO_SCALE
to retrieve the scaling parameters, based on the scale information available in the iio_chan_spec
structure that describes the channel.
For the IIO_CHAN_INFO_RAW
case, most drivers return an IIO_VAL_INT type which can be simply “returned” into the *val
argument. It is however possible to return a fixed point number, in this case the logic explained right after applies.
For the IIO_CHAN_INFO_SCALE
case, the return value indicates what type of scaling should be done. In most cases here a fixed point value will be used so *val
and *val2
will carry the scaling parameters. Here are two examples:
IIO_TEMP
example:*val = 1; *val2 = 8; ret = IIO_VAL_FRACTIONAL;
The full scale sample value should be multiplied by 1/8 in order to get Celcius degrees.
-
IIO_VOLTAGE
example:*val = 2500; *val2 = 10; ret = IIO_VAL_FRACTIONAL_LOG2;
The full scale range is a 10-bit value mapped to a 0-2500mV input level, said otherwise the scaling factor should be 2500 / 1024. The core will automatically do the computation of this factor and return 2,44140625 to the user in order to get milli-Volts.
Sampling
There are two basic common cases here.
In simple situations, a “single” on-demand read was issued by user-space directly by reading /sys/bus/devices/iio:device
. In this case the ->read_raw()
callback should handle basically all the steps necessary to get a measurement, as detailed in our introduction.
However, user-space can also pick a more advanced way of interacting with the measurement device, called triggers.
A trigger is a specific configuration of the device which will sample a number of channels upon a specific event. This event might be the user requesting it from userspace with a so called software trigger, it might also be an external hardware event, or a periodic signal, or an internal continuous read mode… There are many ways of triggering a sensor and they are all covered by the subsystem.
Many devices cannot handle both modes at the same time. The only situation where this might work smoothly is when a device provides a hardware FIFO where you can read from (or a ‘latest value’ register) while not disrupting the FIFO read back. Otherwise, it will be needed, in order to avoid collisions between these two modes, to verify that exclusive access to the device is granted with a call to iio_device_claim_direct_mode()
when starting a direct mode operation. As this helper grabs a mutex, it should be only called from process context and always be balanced with a call to iio_device_release_direct_mode()
.
IIO interoperability model
In the IIO core these four concepts are used:
- IIO device: the hardware part which produces samples
- IIO trigger: the signaling capability to request a conversion start
- IIO buffers: where to store the samples
- IIO events: threshold detectors
Even though a single hardware device might have hardware support for all these features, they must be described and handled separately so that, when applicable, other IIO devices might use them as well, eg. IIO device 2 could start a conversion upon IIO device 1 trigger state change. In practice it is not always possible but the way the API is built should lead us to keep things well separated anyway.
Registering a trigger
A struct iio_trigger
must be allocated by devm_iio_trigger_alloc()
, giving the new trigger a name.
The trigger should then receive a set of operations (struct iio_trigger_ops
) with at least ->set_trigger_state()
implemented, in order to switch on and off the trigger. One can use iio_trigger_set_drvdata()
in order to link private data with the trigger and get this pointer back from the trigger callbacks.
Once initialized, devm_iio_trigger_register()
will register the IIO trigger. This trigger will appear as a dedicated IIO device in sysfs.
It is likely that an IRQ will need to be registered as part of the trigger initialization step: the driver must be notified somehow that the trigger was toggled. If the asynchronous signaling is tied to a “trigger change” condition, which is the easiest situation, then it is advised to provide iio_trigger_generic_data_rdy_poll()
as hard IRQ handler. This helper will just call iio_trigger_poll()
and return.
You may of course want to handle more than this but in any case the rule is clear, triggers, buffers and devices should be fully separated. Hence, do not directly handle any data from this handler: an IIO trigger is only supposed to indicate a hardware transition, no more.
The call to iio_trigger_poll()
will effectively go through the IIO internal interrupt tree, find the device that is connected to the trigger which fired and call the relevant handler in order to request the waiting device to process the data (which may be identical or different than the triggering device).
In the case of the device being limited to, for instance, an End Of Conversion (EOC) interrupt, you should still consider this signal as being suitable for being registered as a trigger. Yes, this might imply an additional delay between the hardware toggling and the IRQ being fired which is not ideal, but from a software point of view, the split between driver code and core logic will let other IIO devices use this IRQ as a trigger with no additional change needed to your code.
Note: There is one exception here. When a device does not provide any visible per-scan interrupt and the software has only access to some kind of FIFO watermark events, the whole trigger + buffer representation is swapped with a pure buffer-only implementation.
Registering triggered buffers
If the device itself is able to provide fast samples, the driver should also register a buffer, with iio_triggered_buffer_setup()
. Both a hard IRQ handler and a threaded IRQ handler can be registered, as well as additional callbacks called before and after enabling and disabling the buffers in order to eg. configure the requested channels based on the current ->active_scan_mask
.
Upon a trigger condition, these are the handlers that might be chosen by the core if the trigger is connected to your device!
The hard IRQ handler might be used to eg. save timestamps. The threaded IRQ handler is dedicated to the data processing. Depending of the type of trigger (iio_trigger_using_own()
) the driver must decide whether it should start a conversion manually or if the data is waiting somewhere in a hardware FIFO, ready to be retrieved.
The final step is to push the samples into the core’s buffers. This should not be done manually. Let’s say that the user requested channels 0, 1 and 3 while the selected scan mask was including all channels from 0 to 4. Just calling iio_push_to_buffers()
is the solution: the core knows that it will receive five samples of 16 bits, it also knows that the user only requested three of them and will automatically pick the right ones.
With all these IIO objects registered, you should be able to properly interact with the core and the other drivers, providing trigger capabilities to third party devices, or benefiting from other’s triggers.
What if my design lacks trigger capabilities?
You can still use triggers by enabling IIO_CONFIGFS
(enables the configuration interface) and IIO_SW_TRIGGER
. Then, you can either choose to trigger your scans from userspace with a simple file write, thanks to CONFIG_IIO_SYSFS_TRIGGER
, or leverage timers to get periodic scans with CONFIG_IIO_HRTIMER_TRIGGER
.
As an example, here is how to create a sysfs trigger:
# echo 0 > /sys/bus/iio/devices/iio_sysfs_trigger/add_trigger # cat /sys/bus/iio/devices/iio_sysfs_trigger/trigger0/name sysfstrig0
And here is how to create a timer based software trigger:
# mkdir -p /config # mount -t configfs none /config # mkdir /config/iio/triggers/hrtimer/my_5ms_trigger # cat /sys/bus/iio/devices/trigger0/name my_5ms_trigger # echo 200 > /sys/bus/iio/devices/trigger0/sampling_frequency
How to use triggers and buffers from userspace
Just for the reference, linking an IIO trigger to an IIO device is as simple as:
# cat /sys/bus/iio/devices/trigger0/name > /sys/bus/iio/devices/iio:device0/trigger/current_trigger
The next step is to configure the channels that should be scanned:
# echo 1 > /sys/bus/iio/devices/iio:device0/scan_elements/in_voltage0_en # echo 1 > /sys/bus/iio/devices/iio:device0/scan_elements/in_voltage1_en # echo 1 > /sys/bus/iio/devices/iio:device0/scan_elements/in_voltage3_en
Starting the sampling process is managed with:
# echo 1 > /sys/bus/iio/devices/iio:device0/buffer/enable
In the case of a sysfs software trigger, it is the user’s responsibility to timely run:
# echo 1 > /sys/bus/iio/devices/trigger0/trigger_now
The samples are available to be read in /dev/iio\:device0
.
The decoding process before the scaling operation must be performed by the userspace, following the content of:
# cat /sys/bus/iio/devices/iio:device0/scan_elements/in_voltage0_type be:u12/16>>2
Which in this case would mean that each sample is 16 bits wide, values should be considered big-endian, shifted twice before being considered as an unsigned 12-bit value.
# od -t x1 /dev/iio\:device0 0000000 08 06
Should be interpreted as 0x806 >> 2 = 0x201
, which should be then multipled by the scaling factor in order to get the final mV value.
Conclusion
While contributing to this (relatively new) subsystem, we discovered a number of interesting features and design choices which would really benefit from a much tougher in-kernel documentation as most of the available information explains how to use IIO (with libiio
or configfs
) more than how to write a decent and properly shaped IIO device driver. As the subsystem is still pretty recent, it is valid to look at existing drivers to make design choices, but that is not a magic solution as no device never fully matches any software API anyway, and sensors unfortunately do not escape from that sticky rule.
We want to warmly thank Jonathan Cameron, IIO founder and maintainer, for his precious feedback on the mailing list, as well as his valuable review and contribution to this blog post.
We hope this article will help you go through this API and if it does, please mind letting us know by dropping a comment in the section down below!
Mainline Linux support for the ARM Primecell PL35X NAND controller
It has been more than 7 years since the first draft of a Linux kernel driver for the ARM Primecell PL35X NAND controller was posted on a public mailing list. Maybe because of the lack of time, each new version was delayed so much that it actually needed another iteration just to catch up with the latest internal API changes in the MTD subsystem (quite a number of them happened in the last 2-3 years). The NAND controller itself is part of an ARM Primecell Static Memory bus Controller (SMC) which increased the overall complexity. Finally, the way the commands and data are shared with the memory controller is very specific to the SMC. All these technical points probably played against Xilinx engineers, and Bootlin was contracted in 2021 to finalize the work of getting the ARM Primecell PL35X NAND controller driver in the upstream Linux kernel.
Static Memory Controller principles
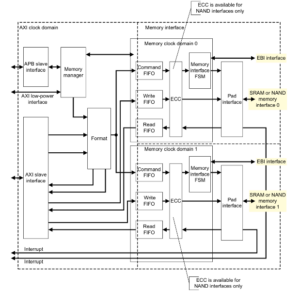
The SMC can interface with two different memory types: NAND or SRAM/NOR. As it features two memory slots, this means that it can drive two memories, but they must be of the same type. When handling NAND devices, a hardware ECC engine is available to perform on-the-fly correction.
As only a single type of memory device can be plugged in at a time (either two SRAM/NORs or two NANDs), we don’t need to share a lot of controls with the SRAM/NOR controllers. So in the end the memory bus driver is almost an empty envelope that relies on the child controller driver to do the job.
Interactions with a memory device
On the CPU side, the controller has two main interfaces: APB
and AXI
.
The APB
interface works like any regular interface: the CPU sees registers that it can access with diverse read and write operations, which will effectively read and write the content of the 32-bit registers located at the desired addresses. This is how the driver configures the device type, the timings, the possible ECC configuration and so forth. All the initial SMC configuration is done through the APB
interface.
The AXI
interface does not quite work like this. Instead of featuring a set of registers at a fixed address in which the content of the command, address and data cycles would be written in order to be forwarded to the memory device, the AXI interface needs to reserve a notable range in the addressable space. In particular, the offset targetted by the AXI write depend on the type of action that must be performed and the content of the action:
- When requesting the controller to send command and address cycles to the memory device, the datasheet refers to it as the “command phase”.
- When doing I/Os, eg. actually reading from/writing to the memory device, the datasheet calls this the “data phase”.
Both the command and data phase use regular AXI read/writes, but the offsets and values are different than usual.
Command phase
When the driver wants to send command cycles, it must perform one or two register writes. The address of the write operation in the AXI address space must target a specific offset. This offset indicates a number of information:
- A specific bit is set to tell the SMC that it must enter a command phase.
- Part of the offset are made of the shifted values of the different command opcodes for the memory device.
- Part of the offset encodes the number of address cycles to perform on the NAND bus.
The payload of the AXI write contains the value of the address cycles that should be forwarded to the memory device. If there are more than 4 address cycles (which is quite common today), then a second AXI write containing the remaining address cycles as payload must happen at the same offset as before.
/* * Define the offset in the AXI address space where to write with: * - the bit indicating the command phase * - the number of address cycles * - the command opcode */ cmd_addr = PL35X_SMC_CMD_PHASE | PL35X_SMC_CMD_PHASE_NADDRS(naddr_cycles) | PL35X_SMC_CMD_PHASE_CMD0(NAND_CMD_XXXX); /* Define the payload with the address bytes */ for (i = 0, row = 0; row < nrows; i++, row++) { [...] if (row < 4) addr1 |= PL35X_SMC_CMD_PHASE_ADDR(row, addr); else addr2 |= PL35X_SMC_CMD_PHASE_ADDR(row - 4, addr); } /* Send the command and address cycles */ writel(addr1, nfc->io_regs + cmd_addr); if (naddr_cycles > 4) writel(addr2, nfc->io_regs + cmd_addr);
Data phase
The data phase is a bit easier to understand: several AXI reads or writes will be performed at a specific offset. The payload matches our expectations: it is actually the data that we want to read from or write to the device. However, the offset in the AXI address space is again a bit counter-intuitive:
- It contains a specific bit such as the command phase to inform the controller that the data phase must be entered.
- It also contains shifted values of different flags regarding the ECC configuration. The thing is, this offset will change at the end of the I/O operation because the last chunk of data must always be handled differently because of the ECC calculations that must be manually started. We end up reading or writing physically contiguous data by accessing two completely different offsets.
/* I/O transfers: simple case */ for (i = 0; i < buf_end; i++) { data_phase_addr = PL35X_SMC_DATA_PHASE; if (i + 1 == buf_end) data_phase_addr += PL35X_SMC_DATA_PHASE_ECC_LAST; writel(buf32[i], nfc->io_regs + data_phase_addr); }
But what happens if a command cycle must be sent at the end of a data transfer (typical case of a PAGE_WRITE
)? While it would certainly be more logical to perform an additional command phase AXI write, it was certainly more optimized to merge data and command phase on the last access. And here is how it looks like:
/* I/O transfers: less straightforward situation */ for (i = 0; i < buf_end; i++) { data_phase_addr = PL35X_SMC_DATA_PHASE; if (i + 1 == buf_end) data_phase_addr += PL35X_SMC_DATA_PHASE_ECC_LAST | PL35X_SMC_CMD_PHASE_CMD1(NAND_CMD_PAGEPROG) | PL35X_SMC_CMD_PHASE_CMD1_VALID); writel(buf32[i], nfc->io_regs + data_phase_addr); }
Of course, nothing highly unreadable, but at the very least, these accesses are quite uncommon.
A memory bus driver and a NAND controller driver
As explained earlier, this SMC controller can support different types of memories, and this has called for a Device Tree representation where the SMC controller is one node, and the memories connected to it are represented as sub-node. So, the Device Tree representation of the SMC controller, used with its NAND controller looks like this:
smcc: memory-controller@e000e000 { compatible = "arm,pl353-smc-r2p1", "arm,primecell"; reg = <0xe000e000 0x0001000>; clock-names = "memclk", "apb_pclk"; clocks = <&clkc 11>, <&clkc 44>; ranges = <0x0 0x0 0xe1000000 0x1000000 /* Nand CS region */ 0x1 0x0 0xe2000000 0x2000000 /* SRAM/NOR CS0 region */ 0x2 0x0 0xe4000000 0x2000000>; /* SRAM/NOR CS1 region */ #address-cells = <2>; #size-cells = <1>; nfc0: nand-controller@0,0 { compatible = "arm,pl353-nand-r2p1"; reg = <0 0 0x1000000>; #address-cells = <1>; #size-cells = <0>; }; };
So, we first have a node for the SMC controller itself, memory-controller@e000e000
, which will allow probing the memory bus driver located at drivers/memory/pl353-smc.c
. This driver is very simple: it enables the clocks necessary for the SMC to work, and then it probes the first child device that matches either the cfi-flash
or arm,pl353-nand-r2p1
compatible strings. In the latter case (which is illustrated in our example), the NAND controller driver at drivers/mtd/nand/raw/pl35x-nand-controller.c
will be probed, and where the two memory areas (accessed through APB and AXI) will be mapped, and accessed to program the NAND controller.
Now in the mainline Linux kernel
Starting from the latest version posted by Xilinx, Miquèl Raynal, Bootlin’s NAND/MTD expert, performed a massive cleanup of the memory bus driver and the NAND controller driver, rewrote entirely the binding file (in YAML
schema!) and three versions later, with the support of Xilinx engineers and the acknowledgements of Rob Herring and Krzysztof Kozlowski, managed to finally close the story. The driver is now part of Linux 5.14-rc, and will therefore be in the final Linux 5.14 release in a few weeks!
Bringing NV-DDR support to parallel NAND flashes in Linux
We have recently contributed support for NV-DDR interfaces to parallel NAND flashes in the Linux kernel, which brings performance improvements for a number of NAND flash devices. In this article, we will detail what are the ONFI specifications, the historical SDR interface, then the introduction of faster interfaces in the ONFI specification, and finally our work to support such interfaces in the Linux kernel.
ONFI specifications
Even though specifications came after the introduction of NAND devices on the market, the Open NAND Flash Interface (ONFI) specification is nowadays a de-facto specification which many NAND chip support (even non-ONFI ones). For instance, in the Linux kernel, we assume that any NAND flash device will by default, after a reset command, at least support the slowest set of ONFI timings. Other specifications exist, like the Joint Electron Device Engineering Council (JEDEC), but as it is a bit less common in the parallel NAND flashes world, we will focus on the ONFI details in this blog post.
The early days of the SDR interface
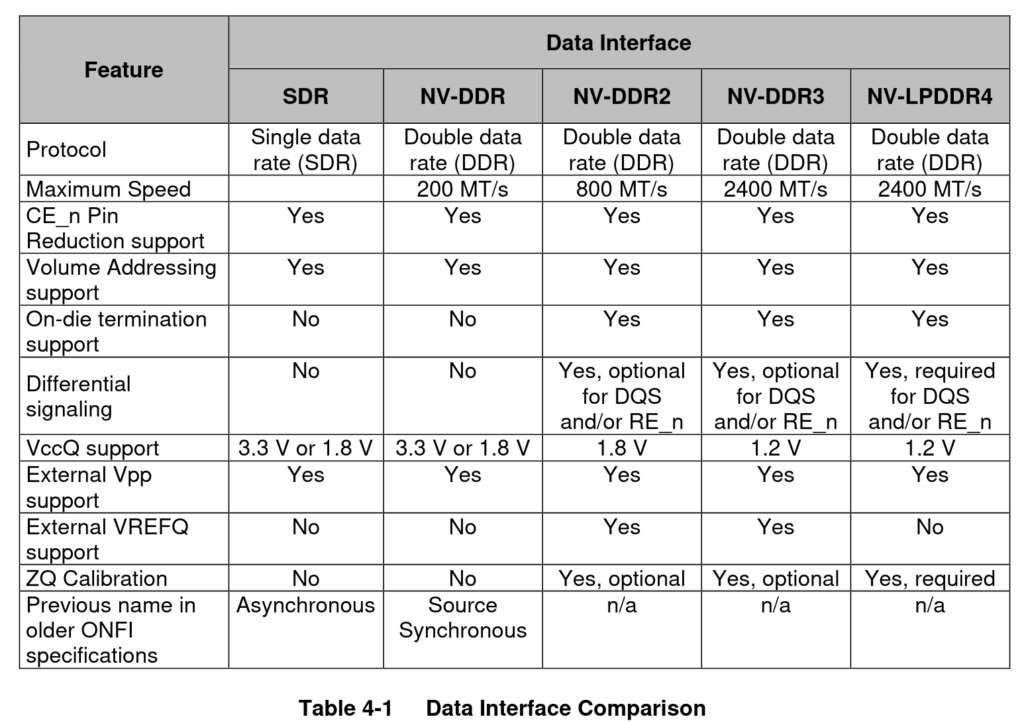
At the time of the first ONFI specification back in 2006, there was only a single interface detailed: the asynchronous data interface. Also known as Single Data Rate or SDR interface in modern language, it defines the timings sequence that should be respected in order for any NAND controller to be able to deal with almost any kind of NAND device. As an asynchronous interface, in this interface, the data bus has no clock signal. Instead, it features a specific set of signals which are asserted by the controller to signal read data latch and write data latch: Read Enable (RE#
) and Write Enable (WE#
).
The data interface can work in 6 different timing modes, from 0 to 5. 0 is the slowest mode and the default one at boot time with a theoretical data rate of about 10MiB/s (assuming an 8-bit bus). Mode 4 and 5 are the fastest, they leverage the ability of Extended Data Output (EDO) to latch data on both RE#
/WE#
edges and may reach a theoretical data rate of 50MiB/s.
The introduction of faster interfaces
Shortly after, at the beginning of 2008, the ONFI consortium released the second version of the ONFI specification and included a new interface: the source synchronous data interface. This interface is backward compatible with the asynchronous interface and allows the host to switch from one interface to the other if this is needed. In the particular case of the source synchronous interface, a clock (CLK
) signal is replacing the legacy WE#
signal and indicates when the commands and address should be latched. The direction of the transfers is handled by the Write/Read signal (W/R#
) in place of RE#
signal. Finally, a data strobe (DQS
) signal is being introduced and indicates when the data should be latched. As both edges of the DQS
signal advertise for a data latch, the source synchronous interface is also called Double Data Rate (DDR) interface even though this naming was only introduced in the version 3.0 of the specification, in 2011.
The exact terms that are used in more recent specifications are NV-DDR (Non-Volatile DDR), NV-DDR2 and NV-DDR3 which are backward compatible improvements of the NV-DDR interface. For instance, the first NV-DDR specification has a range of theoretical rates from 40MiB/s to 200MiB/s.
Support in the Linux kernel
While the addition of the MTD/NAND subsystem in the Linux kernel predates the Git era and is now over 20 years old, Linux users have always been limited to use the asynchronous interface (SDR modes). At Bootlin, we recently started an effort to bring support for the NV-DDR interface to the Linux kernel MTD/NAND subsystem, and this involved the following changes:
- Introducing an API to propose timings to the host controller driver, so that it might either accept or refuse them (only SDR mode 0 cannot be refused) and be aware of all timings that this choice involves so that the host controller registers will be configured properly.
- Adding the possibility for NAND chip drivers to tweak the timings if the parameter page is not present or inaccurate.
- Adding the core logic to ask the NAND chip to change its data interface through the use of
GET_FEATURE
andSET_FEATURE
calls, as well as verifying that this operation worked correctly and handling the fallback in case of error.
We recently reached a final step in this effort as the last missing parts will be part of the next Linux kernel release (v5.14). This final series aiming at bringing NV-DDR support to Linux carries the following changes:
- Adding the necessary bits to parse the parameter page of the NAND device in order to know which NV-DDR modes the chips support.
- Providing the reference implementation of all NV-DDR timing modes and various helpers to manage them.
- Adding the necessary infrastructure and helpers to the host controller drivers in order to allow them to distinguish between SDR and NV-DDR, as well as advertise which mode they are willing to support based on the controller’s constraints.
- Updating the existing logic to take into account the existence of NV-DDR timings and select them when appropriate. This part is a bit trickier as the core must gracefully fallback to SDR modes under certain conditions.
Overall, thanks to the major cleanups which happened in the NAND subsystem in the last three years, it was pretty straightforward to add support for these new timings.
Future work
It is worth mentioning that accelerating the overall throughput on the data bus without a deeper rework of the MTD core than just enabling faster timings is very limiting: data reads must respect a tR delay before starting and writes are considered effective only after a tPROG delay. Both are significantly high in practice: respectively about 25-45us and 200-600us, compared to the time needed to store/fetch the data through the I/O bus: a few dozens of micro-seconds.
To fully leverage the power of NV-DDR timings the NAND and MTD cores should be partially rewritten to bring parallel multi-die support and cached operations. Such features would allow to optimize the use of the I/O bus in order to mitigate the performances impact of tR and tPROG during massive I/O operations. This is precisely one of the tricks used by SSD drives to exhibit very fast I/Os while using multiple NAND chips behind. There is therefore interesting additional work to do in the Linux kernel MTD subsystem to fully benefit from NV-DDR interfaces.
Supporting a misbehaving NAND ECC engine
Over the years, Bootlin has grown a significant expertise in U-Boot and Linux support for flash memory devices. Thanks to this expertise, we have recently been in charge of rewriting and upstreaming a driver for the Arasan NAND controller, which is used in a number of Xilinx Zynq SoCs. It turned out that supporting this NAND controller had some interesting challenges to handle its ECC engine peculiarities. In this blog post, we would like to give some background about ECC issues with NAND flash devices, and then dive into the specific issues that we encountered with the Arasan NAND controller, and how we solved them.
Ensuring data integrity
NAND flash memories are known to be intrinsically rather unstable: over time, external conditions or repetitive access to a NAND device may result in the data being corrupted. This is particularly true with newer chips, where the number of corruptions usually increases with density, requiring even stronger corrections. To mitigate this, Error Correcting Codes are typically used to detect and correct such corruptions, and since the calculations related to ECC detection and correction are quite intensive, NAND controllers often embed a dedicated engine, the ECC engine, to offload those operations from the CPU.
An ECC engine typically acts as a DMA master, moving, correcting data and calculating syndromes on the fly between the controller FIFO’s and the user buffer. The engine correction is characterized by two inputs: the size of the data chunks on which the correction applies and the strength of the correction. Old SLC (Single Level Cell) NAND chips typically require a strength of 1 symbol over 4096 (1 bit/512 bytes) while new ones may require much more: 8, 16 or even 24 symbols.
In the write path, the ECC engine reads a user buffer and computes a code for each chunk of data. NAND pages being longer than officially advertised, there is a persistent Out-Of-Band (OOB) area which may be used to store these codes. When reading data, the ECC engine gets fed by the data coming from the NAND bus, including the OOB area. Chunk by chunk, the engine will do some math and correct the data if needed, and then report the number of corrected symbols. If the number of error is higher than the chosen strength, the engine is not capable of any correction and returns an error.
The Arasan ECC engine
As explained in our introduction, as part of our work on upstreaming the Arasan NAND controller driver, we discovered that this NAND controller IP has a specific behavior in terms of how it reports ECC results: the hardware ECC engine never reports errors. It means the data may be corrected or uncorrectable: the engine behaves the same. From a software point of view, this is a critical flaw and fully relying on such hardware was not an option.
To overcome this limitation, we investigated different solutions, which we detail in the sections below.
Suppose there will never be any uncorrectable error
Let’s be honest, this hypothesis is highly unreliable. Besides that anyway, it would imply that we do not differentiate between written/erased pages and users would receive unclean buffers (with bitflips), which would not work with upper layers such as UBI/UBIFS which expect clean data.
Keep an history of bitflips of every page
This way, during a read, it would be possible to compare the evolution of the number of bitflips. If it suddenly drops significantly, the engine is lying and we are facing an error. Unfortunately it is not a reliable solution either because we should either trigger a write operation every time a read happens (slowing down a lot the I/Os and wearing out very quickly the storage device) or loose the tracking after every power cycle which would make this solution very fragile.
Add a CRC16
This CRC16 could lay in the OOB area and help to manually verify the data integrity after the engine’s correction by checking it against the checksum. This could be acceptable, even if not perfect in term of collisions. However, it would not work with existing data while there are many downstreams users of the vendor driver already.
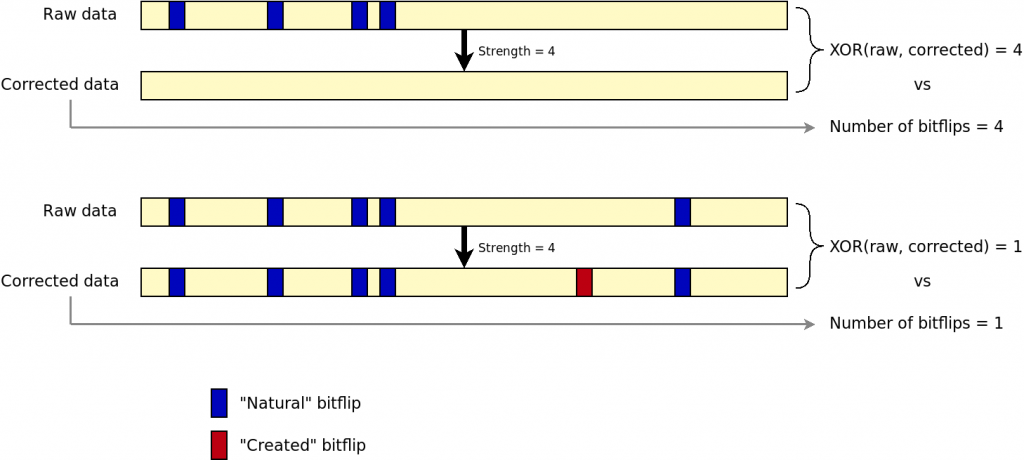
Use a bitwise XOR between raw and corrected data
By doing a bitwise XOR between raw and corrected datra, and compare with the number of bitflips reported by the engine, we could detect if the engine is lying on the number of corrected bitflips. This solution has actually been implemented and tested. It involves extra I/Os as the page must be read twice: first with correction and then again without correction. Hence, the NAND bus throughput becomes a limiting factor. In addition, when there are too many bitflips, the engine still tries to correct data and creates bitflips by itself. The result is that, with just a XOR, we cannot discriminate a working correction from a failure. The following figure shows the issue.
Rely on the hardware only in the write path
Using the hardware engine in the write path is fine (and possibly the quickest solution). Instead of trying to workaround the flaws of the read path, we can do the math by software to derive the syndrome in the read path and compare it with the one in the OOB section. If it does not match, it means we are facing an uncorrectable error. This is finally the solution that we have chosen. Of course, if we want to compare software and hardware calculated ECC bytes, we must find a way to reproduce the hardware calculations, and this is what we are going to explore in the next sections.
Reversing a hardware BCH ECC engine
There is already a BCH library in the Linux kernel on which we could rely on to compute BCH codes. What needed to be identified though, were the BCH initial parameters. In particular:
- The BCH primary polynomial, from which is derived the generator polynomial. The latter is then used for the computation of BCH codes.
- The range of data on which the derivation would apply.
There are several thousands possible primary polynomials with a form like x^3 + x^2 + 1
. In order to represent these polynomials more easily by software, we use integers or binary arrays. In both cases, each bit represents the coefficient for the order of magnitude corresponding to its position. The above example could be represented by b1101
or 0xD
.
For a given desired BCH code (ie. the ECC chunk size and hence its corresponding Gallois Field order), there is a limited range of possible primary polynomials which can be used. Given eccsize
being the amount of data to protect, the Gallois Field order is the smallest integer m
so that: 2^m > eccsize
. Knowing m
, one can check these tables to see examples of polynomials which could match (non exhaustive). The Arasan ECC engine supporting two possible ECC chunk sizes of 512 and 1024 bytes, we had to look at the tables for m = 13
and m = 14
.
Given the required strength t
, the number of needed parity bits p
is: p = t x m
.
The total amount of manipulated data (ECC chunk, parity bits, eventual padding) n
, also called BCH codeword in papers, is: n = 2^m - 1
.
Given the size of the codeword n
and the number of parity bits p
, it is then possible to derive the maximum message length k
with: k = n - p
.
The theory of BCH also shows that if (n, k)
is a valid BCH code, then (n - x, k - x)
will also be valid. In our situation this is very interesting. Indeed, we want to protect eccsize
number of symbols, but we currently cover k
within n
. In other words we could use the translation factor x
being: x = k - eccsize
. If the ECC engine was also protecting some part of the OOB area, x
should have been extended a little bit to match the extra range.
With all this theory in mind, we used GNU Octave to brute force the BCH polynomials used by the Arasan ECC engine with the following logic:
- Write a NAND page with a
eccsize
-long ECC step full of zeros, and another one full of ones: this is our known set of inputs. - Extract each BCH code of
p
bits produced by the hardware: this is our known set of outputs.
For each possible primary polynomial with the Gallois Field order m
, we derive a generator polynomial, use it to encode both input buffers thanks to a regular BCH derivation, and compare the output syndromes with the expected output buffers.
Because the GNU Octave program was not tricky to write, we first tried to match with the output of Linux software BCH engine. Linux using by default the primary polynomial which is the first in GNU Octave’s list for the desired field order, it was quite easy to verify the algorithm worked.
As unfortunate as it sounds, running this test with the hardware data did not gave any match. Looking more in depth, we realized that visually, there was something like a matching pattern between the output of the Arasan engine and the output of Linux software BCH engine. In fact, both syndromes where identical, the bits being swapped at byte level by the hardware. This observation was made possible because the input buffers have the same values no matter the bit ordering. By extension, we also figured that swapping the bits in the input buffer was also necessary.
The primary polynomial for an eccsize
of 512 bytes being already found, we ran again the program with eccsize
being 1024 bytes:
eccsize = 1024
eccstrength = 24
m = 14
n = 16383
p = 336
k = 16047
x = 7855
Trying primary polynomial #1: 0x402b
Trying primary polynomial #2: 0x4039
Trying primary polynomial #3: 0x4053
Trying primary polynomial #4: 0x405f
Trying primary polynomial #5: 0x407b
[...]
Trying primary polynomial #44: 0x43c9
Trying primary polynomial #45: 0x43eb
Trying primary polynomial #46: 0x43ed
Trying primary polynomial #47: 0x440b
Trying primary polynomial #48: 0x4443
Primary polynomial found! 0x4443
Final solution
With the two possible primary polynomials in hand, we could finish the support for this ECC engine.
At first, we tried a “mixed-mode” solution: read and correct the data with the hardware engine and then re-read the data in raw mode. Calculate the syndrome over the raw data, derive the number of roots of the syndrome which represents the number of bitflips and compare with the hardware engine’s output. As finding the syndrome’s roots location (ie. the bitflips offsets) is very time consuming for the machine it was decided not to do it in order to gain some time. This approach worked, but doing the I/Os twice was slowing down very much the read speed, much more than expected.
The final approach has been to actually get rid of any hardware computation in the read path, delegating all the work to Linux BCH logic, which indeed worked noticeably faster.
The overall work is now in the upstream Linux kernel:
- Bit-swapping support in the Linux kernel BCH library: lib/bch: Allow easy bit swapping
- The Arasan NAND controller driver, first without hardware ECC support: mtd: rawnand: arasan: Add new Arasan NAND controller
- The addition of hardware ECC support to the Arasan NAND controller driver:
mtd: rawnand: arasan: Support the hardware BCH ECC engine
If you’re interested about more details on ECC for flash devices, and their support in Linux, we will be giving a talk precisely on this topic at the upcoming Embedded Linux Conference!
Measured boot with a TPM 2.0 in U-Boot
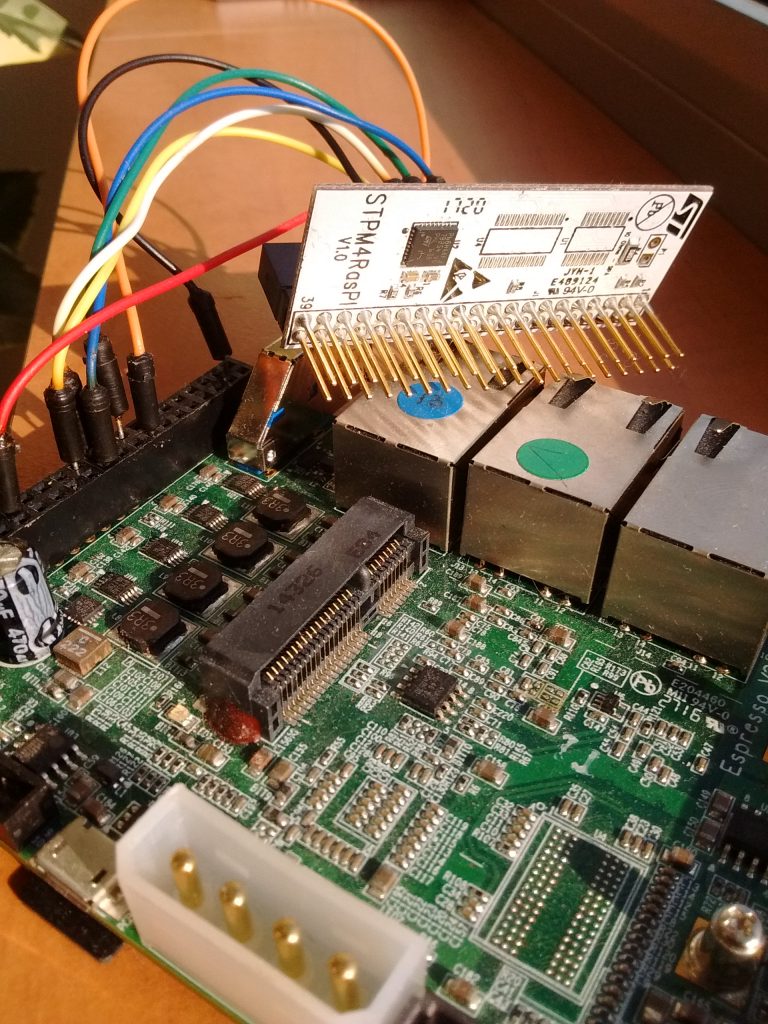
A Trusted Platform Module, in short TPM, is a small piece of hardware designed to provide various security functionalities. It offers numerous features, such as storing secrets, ‘measuring’ boot, and may act as an external cryptographic engine. The Trusted Computing Group (TCG) delivers a document called TPM Interface Specifications (TIS) which describes the architecture of such devices and how they are supposed to behave as well as various details around the concepts.
These TPM chips are either compliant with the first specification (up to 1.2) or the second specification (2.0+). The TPM2.0 specification is not backward compatible and this is the one this post is about. If you need more details, there are many documents available at https://trustedcomputinggroup.org/.
Among the functions listed above, this blog post will focus on the measured boot functionality.
Measured boot principles
Measuring boot is a way to inform the last software stage if someone tampered with the platform. It is impossible to know what has been corrupted exactly, but knowing someone has is already enough to not reveal secrets. Indeed, TPMs offer a small secure locker where users can store keys, passwords, authentication tokens, etc. These secrets are not exposed anywhere (unlike with any standard storage media) and TPMs have the capability to release these secrets only under specific conditions. Here is how it works.
Starting from a root of trust (typically the SoC Boot ROM), each software stage during the boot process (BL1, BL2, BL31, BL33/U-Boot, Linux) is supposed to do some measurements and store them in a safe place. A measure is just a digest (let’s say, a SHA256) of a memory region. Usually each stage will ‘digest’ the next one. Each digest is then sent to the TPM, which will merge this measurement with the previous ones.
The hardware feature used to store and merge these measurements is called Platform Configuration Registers (PCR). At power-up, a PCR is set to a known value (either 0x00s or 0xFFs, usually). Sending a digest to the TPM is called extending a PCR because the chosen register will extend its value with the one received with the following logic:
PCR[x] := sha256(PCR[x] | digest)
This way, a PCR can only evolve in one direction and never go back unless the platform is reset.
In a typical measured boot flow, a TPM can be configured to disclose a secret only under a certain PCR state. Each software stage will be in charge of extending a set of PCRs with digests of the next software stage. Once in Linux, user software may ask the TPM to deliver its secrets but the only way to get them is having all PCRs matching a known pattern. This can only be obtained by extending the PCRs in the right order, with the right digests.
Linux support for TPM devices
A solid TPM 2.0 stack has been around for Linux for quite some time, in the form of the tpm2-tss and tpm2-tools projects. More specifically, a daemon called resourcemgr, is provided by the tpm2-tss project. For people coming from the TPM 1.2 world, this used to be called trousers. One can find some commands ready to be used in the tpm2-tools repository, useful for testing purpose.
From the Linux kernel perspective, there are device drivers for at least SPI chips (one can have a look there at files called tpm2*.c
and tpm_tis*.c
for implementation details).
Bootlin’s contribution: U-Boot support for TPM 2.0
Back when we worked on this topic in 2018, there was no support for TPM 2.0 in U-Boot, but one of customer needed this support. So we implemented, contributed and upstreamed to U-Boot support for TPM 2.0. Our 32 patches patch series adding TPM 2.0 support was merged, with:
- SPI TPMs compliant with the TCG TIS v2.0
- Commands for U-Boot shell to do minimal operations (detailed below)
- A test framework for regression detection
- A sandbox TPM driver emulating a fake TPM
In details, our commits related to TPM support in U-Boot:
- tpm: remove redundant blank line
- tpm: remove extra spaces between a function and its opening bracket
- tpm: substitute deprecated uint
_t types with their u equivalent - tpm: align arguments with open parenthesis
- tpm: use the BIT() macro where applicable
- tpm: fix spelling
- tpm: add extra blank lines between declarations and code
- tpm: add Revision ID field in the chip structure
- tpm: prepare introduction of TPMv2.x support in Kconfig
- tpm: disociate TPMv1.x specific and generic code
- tpm: add missing parameter in private data structure description
- tpm: prepare support for TPMv2.x commands
- tpm: add macros to enhance TPM commands readability
- tpm: add possible traces to analyze buffers returned by the TPM
- tpm: report driver error code to upper layer
- tpm: add TPM2_Startup command support
- tpm: add TPM2_SelfTest command support
- tpm: add TPM2_Clear command support
- tpm: add TPM2_PCR_Extend command support
- tpm: add TPM2_PCR_Read command support
- tpm: add TPM2_GetCapability command support
- tpm: add dictionary attack mitigation commands support
- tpm: add TPM2_HierarchyChangeAuth command support
- tpm: add PCR authentication commands support
- tpm: add support for TPMv2.x SPI modules
- tpm2: tis_spi: add the possibility to reset the chip with a gpio
- doc: device-tree-bindings: add TIS TPMv2.0 SPI module info
- test/py: add TPMv2.x test suite
- tpm: add a Sandbox TPMv2.x driver
- doc: device-tree-bindings: add Sandbox TPMv2.0 module info
- sandbox: dts: add Sandbox TPMv2.x node
- configs: add TPMv2.x support in Sandbox
- tpm: fix typo in kernel doc
- tpm: compile Sandbox driver by default
- tpm: remove stale symbol in Kconfig
- tpm: allow TPM v1 and v2 to be compiled at the same time
- test/py: tpm2: switch from ‘tpm’ to ‘tpm2’ command
- tpm: make TPM_V2 be compiled by default
- sandbox: compile both TPM stack versions and drivers
- tpm: sandbox: fix wrong check on pcr_map
- tpm: sandbox: fix wrong assignment with a simplification
Details of U-Boot commands
Available commands for v2.0 TPMs in U-Boot are currently:
STARTUP
SELF TEST
CLEAR
PCR EXTEND
PCR READ
GET CAPABILITY
DICTIONARY ATTACK LOCK RESET
DICTIONARY ATTACK CHANGE PARAMETERS
HIERARCHY CHANGE AUTH
With this set of functions, minimal handling is possible with the following sequence.
First, the TPM stack in U-Boot must be initialized with:
> tpm init
Then, the STARTUP command must be sent.
> tpm startup TPM2_SU_CLEAR
To enable full TPM capabilities, one must request to continue the self tests (or do them all again).
> tpm self_test full
> tpm self_test continue
This is enough to pursue measured boot as one just need to extend the PCR as needed, giving 1/ the PCR number and 2/ the address where the digest is stored:
> tpm pcr_extend 0 0x4000000
Reading of the extended value is of course possible with:
> tpm pcr_read 0 0x4000000
Managing passwords is about limiting some commands to be sent without previous authentication. This is also possible with the minimum set of commands recently committed, and there are two ways of implementing it. One is quite complicated and features the use of a token together with cryptographic derivations at each exchange. Another solution, less invasive, is to use a single password. Changing passwords was previously done with a single TAKE OWNERSHIP
command, while today a CLEAR
must precede a CHANGE AUTH
. Each of them may act upon different hierarchies. Hierarchies are some kind of authority level and do not act upon the same commands. For the example, let’s use the LOCKOUT
hierarchy: the locking mechanism blocking the TPM for a given amount of time after a number of failed authentications, to mitigate dictionary attacks.
> tpm clear TPM2_RH_LOCKOUT [<pw>]
> tpm change_auth TPM2_RH_LOCKOUT <new_pw> [<old_pw>]
Drawback of this implementation: as opposed to the token/hash solution, there is no protection against packet replay.
Please note that a CLEAR
does much more than resetting passwords, it entirely resets the whole TPM configuration.
Finally, Dictionary Attack Mitigation (DAM) parameters can also be changed. It is possible to reset the failure counter (aka. the maximum number of attempts before lockout) as well as to disable the lockout entirely. It is possible to check the parameters have been correctly applied.
> tpm dam_reset [<pw>]
> tpm dam_parameters 0xffff 1 0 [<pw>]
> tpm get_capability 0x0006 0x020e 0x4000000 4
In the above example, the DAM parameters are reset, then the maximum number of tries before lockout is set to 0xffff, the delay before decrementing the failure counter by 1 and the lockout is entirely disabled. These parameters are for testing purpose. The third command is explained in the specification but basically retrieves 4 values starting at capability 0x6, property index 0x20e. It will display first the failure counter, followed by the three parameters previously changed.
Limitation
Although TPMs are meant to be black boxes, U-Boot current support is too light to really protect against replay attacks as one could spoof the bus and resend the exact same packets after taking ownership of the platform in order to get these secrets out. Additional developments are needed in U-Boot to protect against these attacks. Additionally, even with this extra security level, all the above logic is only safe when used in the context of a secure boot environment.
Conclusion
Thanks to this work from Bootlin, U-Boot has basic support for TPM 2.0 devices connected over SPI. Do not hesitate to contact us if you need support or help around TPM 2.0 support, either in U-Boot or Linux.
Bootlin adds SPI NAND support to U-Boot
Bootlin is proud to announce that it has contributed SPI NAND support to the U-Boot bootloader, which is part of the recently released U-Boot 2018.11. Thanks to this effort, one can now use SPI NAND memories from U-Boot, a feature that had been missing for a long time.
State of the art: Linux support
A few months ago, Bootlin engineer Boris Brezillon added SPI-NAND support in the Linux kernel, based on an initial contribution from Peter Pan. As Boris explained in a previous blog post, adding SPI NAND support in Linux required adding a new spi-mem layer, that allows SPI NOR and SPI NAND drivers to leverage regular SPI controller drivers, but also to allow those SPI controller drivers to expose optimized operations for flash memory access. The spi-mem layer was added to the SPI subsystem by a first series of patches, while the SPI NAND support itself was added to the MTD subsystem as part of another patch series.
Moving to U-Boot
Since accessing flash memories from the bootloader is often necessary, Bootlin engineer Miquèl Raynal took the challenge of adding SPI NAND support in U-Boot. Miquèl did this by porting the SPI-mem and SPI-NAND subsystems from Linux to U-Boot. The first challenge when porting the SPI-mem and SPI-NAND code from Linux to U-Boot was that the U-Boot MTD stack hadn’t been synchronized with the one of Linux for quite some time. Thus a number of changes in the Linux MTD subsystem had to be ported to U-Boot as well, which was a fairly time-consuming effort. The SPI NAND code has been imported in drivers/mtd/nand/spi, while the spi-mem layer is in drivers/spi/spi-mem.c.
Once the core code was ready, we had to find a way to let the user interact with the SPI NAND devices. Until now, U-Boot had a separate set of commands for each type of flash memory (nand
for parallel NAND, erase/cp
for parallel NOR, sf
for SPI NOR), and it indeed seemed like adding yet another command was the way to go. Instead, we introduced a new mtd
that can be used to access all flash memory devices, regardless of their specific type. We will discuss this mtd
in more details in another blog post.
However, such a move to a generic mtd
command forced us to do a lot more cleanup than expected, as we ended up reworking the MTD partition handling, and even making deep changes in the ubi
command. This was more complicated than anticipated because of the SPI NOR support in U-Boot: it is not very well integrated with MTD subsystem, in the sense that there is a duplication of information between the SPI NOR and MTD subsystems, and when the duplicated information is no longer consistent, really bad things happen. As an example, any call to sf probe
was doing a reset of the MTD device structure using memset
, causing all other state information contained in this structure to be lost. Since the SPI NAND support relies on the MTD subsystem (much more than the current SPI NOR support), we had to mitigate those issues. Long term, a proper rework of the SPI NOR support in U-Boot is definitely needed.
Some of those issues are present in the 2018.11 release and were discovered by U-Boot users who started testing the new mtd
command. We have contributed a patch series addressing them, which hopefully should be merged soon.
Now that those difficulties are hopefully behind us, the U-Boot SPI-NAND support looks pretty stable, and we have quite a few SPI-NAND manufacturer drivers in U-Boot mainline, with Gigadevice, Macronix, Micron and Winbond supported so far. We’re happy to have contributed this new significant feature, as it finally allows to use this popular type of flash memory in U-Boot.
Bootlin at the ALPSS 2018 conference
The second edition of the Alpine Linux Persistent Storage Summit (ALPSS) happened two weeks ago in the Lizumerhütte Alpine lodge. Close to Innsbruck, Austria, the lodge resides in an amazingly beautiful valley. Completely separated from the rest of the world in Winter, this year edition was marked by the absence of data network access, intensifying the feeling of isolation, stimulating the exchanges between attendees. To strengthen the representation of MTD developers at this event, Bootlin sent two of his engineers: Boris Brezillon and Miquèl Raynal, respectively MTD and NAND maintainers in the Linux kernel.
NVMe, open-channel and zoned namespaces
While almost all the ~30 attendees work on storage support that are based on NAND flashes, a majority work on domains targeting high-performances, where power-cuts are not the issue but the latency and throughput are. Far beyond our embedded world, people are working hard on the parallelization and the standardization of high-speed interfaces (SCSI, NVMe). In the end, we all have to make the software deals with the NAND-specific constraints of the underlying storage device.
Disclaimer: This is a short summary (not exhaustive) of the “high-performance” world talks as we could understand them. This is probably not 100% accurate as the topics discussed are, currently, out of our domain of expertise. Corrections are welcome.
Matias Bjørling (Western Digital) and Christoph Hellwig presented new NVMe commands to manage NVMe zones. While zones need write order to be preserved, the Linux multi-queue block I/O queueing mechanism (blk-mq) cannot enforce this. Bart van Assche (Google) and Damien Le Moal (Western Digital) proposed a draft to reorder writes at the blk-mq layer. While this solution was not very well received, it opened the discussion on how the issue should be addressed. Bart van Assche also presented his work on copy offload mechanism in Linux, which could for instance serve to fast copy entire zones. His work could be also useful to Stephen Bates who works on PCIe peer-to-peer and talked on how he wants to eg. enable DMA between SSDs. Still on the topic of DMA and performances, Idan Burstein (Mellanox) exposed the cutting-edge features he worked on to improve Remote DMA (RDMA) performances.
MTD was also present to the party
Probably the easier part to understand for us, embedded people.
Boris Brezillon and Miquèl Raynal gave a talk on their recent work support for SPI memories in Linux (and U-Boot, but this will be more detailed at ELCE in October). Boris wrote a new SPI-NAND layer, converting MTD requests into SPI exchanges, giving the flow of commands to the (also brand new) SPI-mem layer to standardize how to speak with SPI controller drivers from both SPI-NAND and SPI-NOR stacks. Cleaning work is still needed on the SPI-NOR side as well as the addition of new features like direct mapping, XIP (that was discussed after the talk), the addition of support for more chips and the conversion to SPI-mem of more SPI controllers. The slides are available online, see also our previous blog post on this topic.
Richard Weinberger (from Sigma Star GmbH, and co-maintainer of MTD and UBI/UBIFS) updated us about the level of power-cut testing available to challenge the MTD stack. Tracing is possible to get closer to the failing sequence but one big problem is to replay the sequence and reproduce the issue. Tracking down untested code path is very important to keep UBI/UBIFS as reliable as possible: this is what is generally the most important when using SPI/parallel NAND devices.
Richard’s co-worker David Gstir also works on UBI/UBIFS, but on the authentication side. Bringing filesystem authentication to UBIFS could have been simple but during his introduction he disqualified most of the alternatives he had (dm-verity, fs-verity, …). Fun-fact about fs-verity, authentication would have work on the file’s contents, but not on the inodes themselves. Hence, the file’s content could not be changed, but the file itself could still be moved. So, a brand new solution has been implemented for UBIFS, upstreaming ongoing.
Original ideas presented
Benchmarking real hardware was somehow not adapted to Damien Le Moal experiments. He hacked QEMU to add the possibility to tune CPU latency so that he could compare easily the latency on in-memory data processing paths. WIP.
Johannes Thumshirn (SUSE Labs), as a side project, started reversing APFS, Apple’s new filesystem. The firm promised two years ago to release the implementation of its filesystem so that computers running Microsoft or Linux could mount it. So far nothing happened, that is why, without even a Mac in hand, he started spending nights hex-dumping structures from a filesystem image he got, reverse-engineering the content with the help of research papers already produced. The first results are there, he can now ls
and cat
random files!
And after talks and hiking: time to BOFs
A bit before the official BOFs time MTD folks gathered around Hans Holmberg (CNEX Labs) to carefully listen about how pblk works, a “Physical block device” FTL for SSDs supporting open-channel that could give ideas to some of them. Why not an entirely open-source SSD running Linux with its own FTL?
Finally, between all the interesting discussions that happened, we could mention the need for a generic NVMe-oF (NVMe over Fabric) discovery protocol raised by Hannes Reinecke (SUSE Labs), and the possible evolution of the MTD stack to integrate an I/O scheduler to provide much better (and parallelized) performances exposed by Boris Brezillon.
Conclusion
All attendees agreed this format of conference is really pleasant, the surrounding helping a lot to the general wellness and the success of this year’s edition of the ALPSS. We will definitely try to make it next year!
Back from ELC North-America: selection of talks from the Bootlin team
As discussed in our previous blog post, Bootlin had again a strong presence at the Embedded Linux Conference North-America, with 8 attendees, 5 talks, one BoF and two E-ALE tutorial sessions.
In this blog post, we would like to highlight a number of talks from the conference that we found interesting. Each Bootlin engineer who attended the conference has selected one talk, and gives his/her feedback about this talk.
Device Tree BoF – Frank Rowand
Talk selected by Michael Opdenacker
The Device Tree BoF (Birds of a Feather session, which means an informal session about a technical topic, allowing participants to openly share questions and information) has been part of Embedded Linux Conferences for at least 2 or 3 years. For me, it has always been a good source of updates about the topic.
Frank started by sharing details about the Device Tree Workshop held in October in Prague, a one day meet-up and workshop for Device Tree contributors (like Maxime Ripard and Thomas Petazzoni from Bootlin who were invited), to address issues and plan for the next months. Slides and notes can be found on elinux.org.
Frank then went on by mentioning utilities, such as:
scripts/dtc/dt_to_config
. It is not very new in the mainline kernel, but useful to generate a kernel configuration suitable for the devices present on your platform, in case you didn’t know this tool exists.- There’s an upcoming patch adding options to
dtc
(--annotate --full
) to keep track of the line numbers in the device tree sources. This helps to locate in which DT source file a given property value comes from. The patch was idle for some time but Julia Lawall volunteered to take care of it. Thanks to her updates, this feature should be accepted in mainline soon. - The device tree compiler in mainline has also been augmented with further build checks. You can now use them by adding
W=1
tomake dtb
. Here is an example for the Beagle Bone Black dtb:
make W=1 am335x-boneblack.dtb CHK scripts/mod/devicetable-offsets.h DTC arch/arm/boot/dts/am335x-boneblack.dtb arch/arm/boot/dts/am335x-boneblack.dtb: Warning (unit_address_vs_reg): Node /ocp/i2c@44e0b000/tda19988 has a reg or ranges property, but no unit name arch/arm/boot/dts/am335x-boneblack.dtb: Warning (unit_address_vs_reg): Node /ocp/i2c@44e0b000/tda19988/ports/port@0 has a unit name, but no reg property arch/arm/boot/dts/am335x-boneblack.dtb: Warning (unit_address_vs_reg): Node /ocp/i2c@44e0b000/tda19988/ports/port@0/endpoint@0 has a unit name, but no reg property arch/arm/boot/dts/am335x-boneblack.dtb: Warning (unit_address_vs_reg): Node /ocp/ethernet@4a100000/slave@4a100200 has a unit name, but no reg property arch/arm/boot/dts/am335x-boneblack.dtb: Warning (unit_address_vs_reg): Node /ocp/ethernet@4a100000/slave@4a100300 has a unit name, but no reg property arch/arm/boot/dts/am335x-boneblack.dtb: Warning (unit_address_vs_reg): Node /ocp/lcdc@4830e000/port/endpoint@0 has a unit name, but no reg property arch/arm/boot/dts/am335x-boneblack.dtb: Warning (simple_bus_reg): Node /ocp/l4_wkup@44c00000/prcm@200000/clocks missing or empty reg/ranges property arch/arm/boot/dts/am335x-boneblack.dtb: Warning (simple_bus_reg): Node /ocp/l4_wkup@44c00000/prcm@200000/clockdomains missing or empty reg/ranges property arch/arm/boot/dts/am335x-boneblack.dtb: Warning (simple_bus_reg): Node /ocp/l4_wkup@44c00000/scm@210000/scm_conf@0/clocks missing or empty reg/ranges property arch/arm/boot/dts/am335x-boneblack.dtb: Warning (simple_bus_reg): Node /ocp/l4_wkup@44c00000/scm@210000/clockdomains missing or empty reg/ranges property
As far as I am concerned, the most interesting news remained the one that since Linux 4.15, device tree overlays are now easier to code. You no longer have to define weird “fragment” elements. You can now directly write normal nodes and use labels. The syntax is now exactly the same as for regular device tree sources!
For more details, grab the slides and if you event want to follow the discussions that happened that day, watch the video.
Tutorial: Introduction to Reverse Engineering – Mike Anderson
Talk selected by Quentin Schulz
Mike presented in an unusual 2-hour-long slot the different techniques to reverse-engineer things and the different reasons why you’d do so. After a mandatory disclaimer that reverse engineering may be illegal in some regions of the world, he introduced the different tools that anyone aspiring to reverse engineer should possess: from the obvious logic analyzer, multimeter, screwdrivers to the surprising heat gun. He then gave the first and very important step of the reverse engineering process: gathering information about the product by looking for patents, the FCC registration, manufacturer as well as carefully opening its case to examine the different components (maybe with the help of a microscope).
Later, Mike gave the multiple ways to retrieve the firmwares from the product, from the soldering of a JTAG interface to the downloading from the official website. He then offered some tools that can be used to dive into binaries and start the guessing game, and he finished his talk with an example of a reverse engineering of a protocol which required a lot of guessing and social reverse engineering.
Mike’s talk was pleasant to attend because of the high-level presentation of how to do reverse engineering while giving a quick real-life example.
For more details, watch the video and grab the slides.
Graphics Performance Analysis with FrameRetrace: A Responsive UI for ApiTrace – Mark Janes, Intel
Talk selected by Boris Brezillon
I first heard of FrameRetrace when Eric Anholt asked us to add support for the VC4 GPU to this tool, and my experience with it had been rather frustrating in that I was mainly struggling to make it work on a not yet supported architecture instead of being a simple user. So, when I saw that Mark was giving a talk on FrameRetrace usefulness and how to use it, I figured I couldn’t miss it. Well, those who looked carefuly at the schedule know I couldn’t attend it because I was giving my talk at the same time, but I did see it at FOSDEM a month before, and I’m pretty sure not much has changed since then.
Mark first described the GPU debugging/perf-anlysis tools ecosystem, saying that each GPU vendor has its own proprietary tools which most of the time are only supported on Windows. FrameRetrace is an attempt at providing a tool that exposes similar features while being open-source, cross-platform, and easily extensible to new hardware. This project is actually based on an exisiting project called ApiTrace, which it uses to capture OpenGL traces. The new feature that is interesting in FrameRetrace is that you can select the frame you want to replay, get all the hardware perf counters exposed by the GPU for this specific rendering job in order to figure out what is going wrong and then play with the OpenGL code to see how you can make things better and replay the rendering job with your local modification to see if it actually solves the problem.
I must admit I was really impressed by the demo, and now I understand why Eric (and others in the community) would like to have their GPU properly supported in FrameRetrace. It really looks like the kind of tool you don’t know you need until you’ve tested it, but once you do, you can’t do without it.
For more details, watch the video and grab the slides.
The Salmon Diet: Up-Streaming Drivers as a Form of Optimization – Gilad Ben-Yossef
Talk selected by Miquèl Raynal
Gilad was hired about a year ago to become the maintainer of the ARM® TrustZone® CryptoCell® device driver. Until now this driver was out of tree until it has been decided to upstream it. Here starts Gilad’s story.
It appeared that the right way to make it upstream was to go through the staging tree and the whole process around it. It was the first time for him to do it that way, that is why he felt it was interesting to share his experience.
At the beginning of his talk, he recalls that the driver was actually working, people already relied on it. Plus, it was released under the GPL. While all of this could make you think it was clean enough, Gilad realized that people who wrote it actually did not think about upstreaming and almost every patch to clean that driver removed more lines than it added, shrinking step by step the driver until 30% of the lines were removed!
Of course, removing the existing hardware abstraction macros was something to do, as well as running and correcting the whole checkpatch.pl
output, but there are plenty of other good habits that one can adapt to his own situation, explained and well illustrated all along this talk.
For more details, watch the video and grab the slides.
Measuring and Summarizing Latencies using the Trace Event Subsystem – Tom Zanussi
Talk selected by Maxime Chevallier
Having some experience dealing with RT topics on Linux, I was looking forward to seeing Tom’s talk about these tracing features.
He gave really good examples on how to use the existing ‘latency histogram’ traces to get a cyclictest-like metric of wakeup latencies by measuring the time between sched_switch
, and explaining how this could be re-used for other measurements such as network latencies.
What he presented was more than just having a trace in a buffer when a function is called. The tracing subsystem allows the use of handlers to perform actions when an event occurs. As an example, he demonstrated how to use the onmax
handler to accumulate the maximum wakeup latency observed, each time saving crucial pieces of information on the execution context.
He then went on to describe the next-level features that are being merged, namely function events by Steven Rostedt, and Inter events by Tom himself. They allow the user to use any of the kernel functions as tracepoints, and build complex events and traces to pinpoint really specific sequences.
I recommend to read this LWN article on inter-event tracing, and of course have a look at Tom’s talk and slides.
Steering Xenomai into the Real-Time Linux Future – Jan Kiszka
Talk selected by Thomas Petazzoni
In this talk, long-term Xenomai developer and Siemens engineer Jan Kiszka gave a very interesting status of the Xenomai project and its roadmap. He started by refreshing the audience about what Xenomai is: an RTOS-to-Linux portability framework. It comes in two flavors: a co-kernel extension for a patched Linux kernel, and as libraries running for native Linux (including PREEMPT_RT). He then went on to compare the respective advantages and drawbacks of the two flavors, citing accurate modeling of legacy RTOS behavior and strong separation of real-time vs. non real-time code as the key advantages of the co-kernel approach.
Jan then summarized the history of Xenomai, from the early days as a sub-project of RTAI to the current status of Xenomai 3.0, released in 2015 after more than 5 years of development. However, even though Xenomai is widely used in the industry, its development relies on just a few individuals. Siemens is a heavy user of Xenomai, and in 2017, they started a discussion: should they migrate away from Xenomai or invest into it. Siemens made the decision to invest in the project. The same year, Xenomai main developer Philippe Gerum published an e-mail RTnet, Analogy and the elephant in the room also calling for help to maintain some parts of Xenomai.
Following those discussions, some changes were decided in the Xenomai project: Philippe Gerum will step back from the project lead, and Jan Kiszka will take over his role.
Regarding the I-Pipe kernel patch (which allows to support the co-kernel approach), the Xenomai project will discontinue a number of architectures (nios2, SH, Blackfin, PPC64, ARM < v7) and will only maintain patches for the latest Linux kernel LTS, in order to reduce the maintenance effort. Jan announced that Xenomai 3.0.7 is soon to be released, that Xenomai 3.1 will introduce ARM64 support, and that Xenomai 2 is unmaintained and therefore users should migrate to Xenomai 3. He also gave a status on the driver stacks, citing that RTnet needs more love, and that Analogy is orphaned and needs a new maintainer. Towards the end of his talk, Jan then started discussing the more distant future of Xenomai. The future version of Xenomai has the goal of improving the integration of the co-kernel approach, to simplify maintenance and possibly provide a chance to be upstreamed in Linux. This new approach will be split in two elements, called Dovetail (interrupt routing, co-kernel hooks) and Steely (co-kernel implementation). He made it clear that this is currently not production-ready at all. He noted that this new implementation allows a significant reduction of the code base, about 50% smaller than the current implementation. The code is already available in two Git repositories: Dovetail and Steely.
All in all, Jan’s talk was a very interesting one, providing a good coverage of Xenomai’s status and future. The video of his talk is definitely worth watching, and the slides are also available.
An Introduction to Asymmetric Multiprocessing: When this Architecture can be a Game Changer and How to Survive It – Nicola La Gloria & Laura Nao
Talk selected by Mylène Josserand
In this talk, Nicola La Gloria and Laura Nao from Kynetics presented how to handle communication between a micro-controller running bare metal code and a CPU with a full OS (such as GNU/Linux or Android).
They showed the different approaches for communication (supervised or not supervised: i.e. CPU and MCU can communicate using an hypervisor or directly) and presented the Inter-Processing Communication.
After this introduction, Laura told us about their use-case, running on an NXP i.MX7, which comprises a Cortex-M4 micro-controller and a Cortex-A7 processor: the MCU retrieves data from a sensor, which will be displayed by the CPU.
She gave feedback on how they implemented this communication and the different mechanisms used (Message Unit, RPMsg, RDC, kexec/kdump, etc). The explanation of the different mechanisms was really interesting, and particularly relevant for those who had never heard about them.
They did a short tutorial and gave some tips that would definitely be appreciated by people who start this kind of project. And finally, they did a demonstration of all the work they have done.
So if you are interested in the subject or even only for your general knowledge, have a look at their talk (video and slides).
System-in-Package Technology: Making it Easier to Build Your Own Linux Computer – Erik Welsh & Jason Kridner
Talk selected by Alexandre Belloni
Eric Welsh started to talk about how software influences hardware design and why open source hardware matters. He then presented the System-in-Package technology and in particular the Octavo OSD3358. It includes a TI AAM335x SoC, DDR3 SDRAM, a PMIC and all the related power circuitry, components which are always required. This allows the hardware engineers to concentrate on the added value of the final product.
Great pictures and videos of the SiP internals and its manufacturing process were shown.
Jason then came on stage to present the OSD3358 integration on the PocketBeagle.
Eric finally explained how easy it is to assemble the OSD3358 on a PCB, even by hand with a video to prove it. He finally concluded by summing up the benefits of using a SiP: easy bring-up, lower cost of PCB, easy manufacturing and migration from SBC prototyping to custom PCB.
It was quite enlightening for software engineers as it showed the hardware internals with some great details.
Have a look at the video and slides.
In conclusion, this was again a really nice opportunity to share and acquire knowledge from other engineers deeply involved in the Open Source community, as well as meeting people that we sometimes know only by their name on a mailing list. Next year this event will happen in Monterey Bay, California (March 19 – 21, 2019). See you there!