Learn how to debug, trace, profile and analyze the performance of Linux systems and applications
Course details

- Duration: 3 days / 24 hours (on-site) – 4 half days / 16 hours (on-line)
- Agenda: on-site – on-line
- Training materials:
- Slides
- Practical labs on ST STM32MP1 Discovery or on TI BeaglePlay
- Lab data for ST STM32MP1 Discovery or for TI BeaglePlay
- Written language: English
- Available oral languages: English, French and Italian.
Types of sessions
- Private on-site session, on request
- Private on-line session, on request
- Public on-line session, dates below
Dates of public on-line sessions
| Type | Dates | Time | Duration | Language | Expected trainer |
Cost and registration |
|---|---|---|---|---|---|---|
| Linux debugging, profiling, tracing and performance analysis (agenda) |
Sep 21, 22, 23, 24, 2026 + extra session on Sep 25, 2026 if needed |
14:00 – 18:00 (Paris, UTC+2) 08:00 AM – 12:00 PM (New York, UTC-4) |
16 h | English | Luca Ceresoli |
Discount: 699 EUR* Regular: 799 EUR* Register now |
| Linux debugging, profiling, tracing and performance analysis (agenda) |
Nov 2, 3, 4, 5, 2026 + extra session on Nov 6, 2026 if needed |
14:00 – 18:00 (Paris, UTC+1) 08:00 AM – 12:00 PM (New York, UTC-5) |
16 h | English | Alexis Lothoré |
Discount: 699 EUR* Regular: 799 EUR* Register now |
| Linux debugging, profiling, tracing and performance analysis (agenda) |
Nov 30, Dec 1, 2, 3, 2026 + extra session on Dec 4, 2026 if needed |
14:00 – 18:00 (Paris, UTC+1) 08:00 AM – 12:00 PM (New York, UTC-5) |
16 h | English | Luca Ceresoli |
Discount: 699 EUR* Regular: 799 EUR* Register now |
Additional sessions at future dates will be announced progressively. We generally announce new sessions when existing ones are either full or already passed. |
*The price is excluding VAT. The online shop charges VAT, except for businesses outside of France if they provide valid company information at registration time. Businesses in France, and individuals registering by themselves must pay VAT.
The discount rate is applicable at the following conditions:
- Booking at least 1 month prior to the training session start
- Booking and payment made online using credit card
- Limit of 6 seats per training session at the discount rate
If you are unable to register through our online shop, do not hesitate to contact us, we will be able to provide a training contract and offer alternative payment methods.
Registration on the online shop remains available until the session starts, subject to seat availability.
Target audience
 This course targets engineers who want to master the debugging, tracing and profiling tools and techniques available on the Linux platform to help in the analysis of bugs, performance issues or memory issues in Linux systems and applications.
Objectives
- Be able to understand the main concepts of Linux that are relevant for performance analysis: process, threads, memory management, virtual memory, execution contexts, etc.
- Be able to analyze why a system is loaded and what are the elements that contributes to this load using common Linux observability tools.
- Be able to debug an userspace application using gdb, either live or after a crash, and analyze the contents of ELF binaries.
- Be able to trace and profile a complete userspace application and its interactions with the Linux kernel in order to fix bugs using strace, ltrace, perf or Callgrind.
- Be able to understand classical memory issues and analyze them using valgrind, libefence or Massif.
- Be able to trace and profile the entire Linux system, using perf, ftrace, kprobes, eBPF tools, kernelshark or LTTng
- Be able to debug Linux kernel issues: debug kernel crashes live or post-mortem, analyze memory issues at the kernel level, analyze locking issues, use kernel-level debuggers.
See the detailed agenda. At the end of this course, you will be ready to use advanced debugging, tracing and profiling tools in Linux and accelerate the investigation of your Linux system/application bugs and performance issues.
Training materials
All the training materials that we use during this course are freely available. Before the session, you can then check that they correspond to your needs.
Practical labs
 In our on-site courses, each lecture is followed by a practical lab done by the participant. The practical labs represent 50% to 60% of the whole course time.
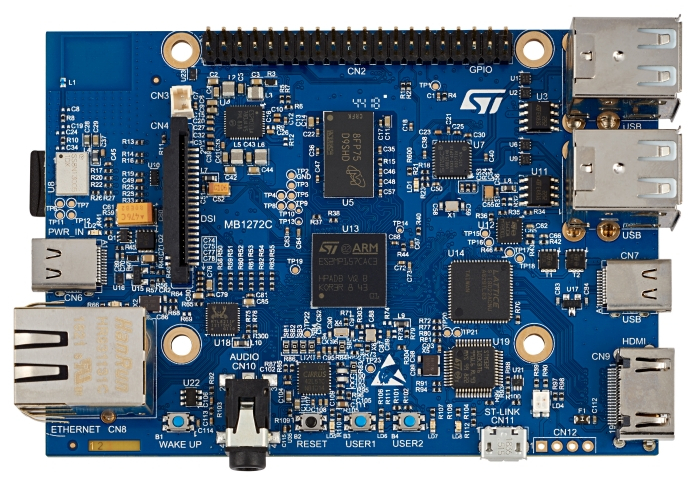
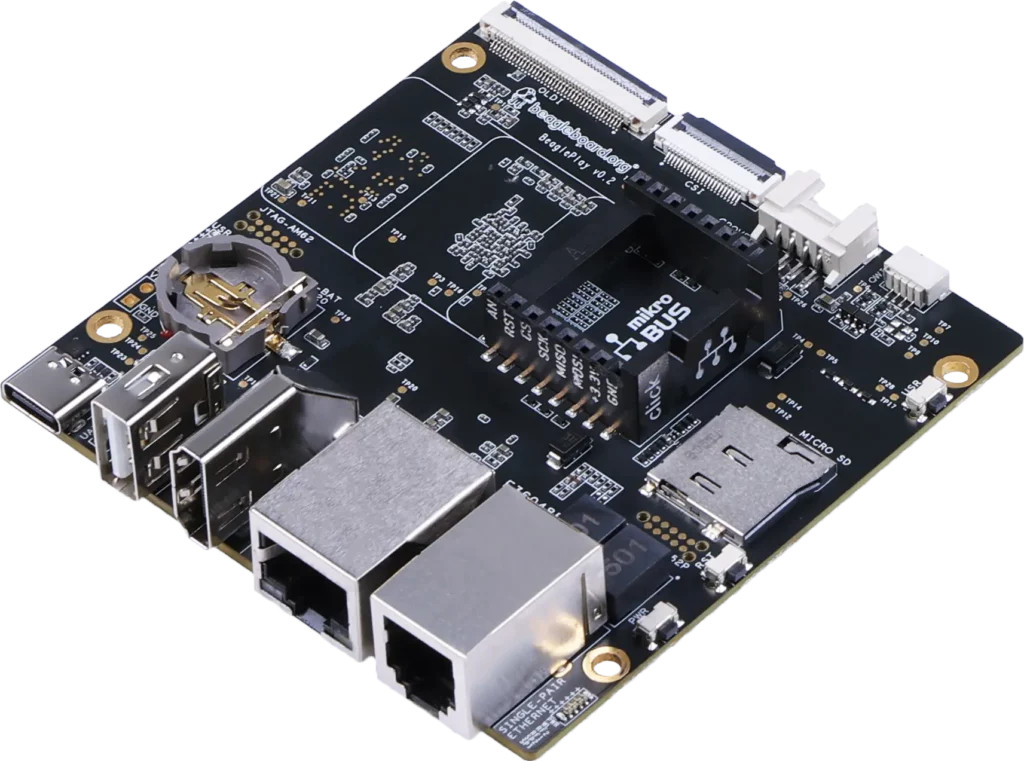
Participants can chose between multiple boards:
- STM32MP157 Discovery (all variants supported: STM32MP157A-DK1, STM32MP157D-DK1, STM32MP157C-DK2, STM32MP157F-DK2)
- BeaglePlay, based on the ARM64 TI AM6256 processor
You will use the hardware platform to experiment the debugging, tracing and profiling tools and techniques on a Linux system. This experience will be relevant regardless of the specific hardware platform you will be using in your own projects.
In our on-line courses, the practical labs are performed as live demonstrations by the trainer. Participants can ask questions at any time. Optionally, the participants who have access to the necessary hardware accessories can reproduce the labs by themselves.
Keep in mind that in any case our course is hardware-agnostic, and therefore it is relevant even if the target platform for your next project is not exactly the one used for the practicall labs during our course.
Prerequisites
- Knowledge and practice of UNIX or GNU/Linux commands: participants must be familiar with the Linux command line. Participants lacking experience on this topic should get trained by themselves, for example with our freely available on-line slides at https://bootlin.com/blog/command-line/
- Minimal experience in embedded Linux development: participants should have a minimal understanding of the architecture of embedded Linux systems: role of the Linux kernel vs. user-space, development of Linux user-space applications in C. Following Bootlin’s Embedded Linux course allows to fulfill this pre-requisite.
- Minimal English language level: B1, according to the Common European Framework of References for Languages, for our sessions in English. See the CEFR grid for self-evaluation.
Hardware requirements
- For on-line courses:
- Computer with the operating system of your choice, with the Google Chrome or Chromium browser for videoconferencing.
- Webcam and microphone, from an audio headset
- High speed access to the Internet
- Optionally: the hardware accessories needed for the practical labs, if you want to reproduce the practical labs by yourself. Note that this is not mandatory: you can follow the course without those hardware accessories, as the trainer will perform the practical labs as live demonstrations.
- For on-site courses:
- Training room
- Video projector
- One recent PC computer for each desk (1 or 2 persons) installed with Linux. See the training agenda for detailed requirements.
- Unfiltered and fast connection to the Internet
- Bootlin provides the hardware accessories for the practical labs for the duration of the course
Customer feedback
I found it very insightful and it was a LOT of information in 3 days, but with the materials this will become a valuable source for information for the future. Kudos to Alexis as trainer and I am impressed about the dedication and seriousness – you took every question up as a challenge and even came back with answers the day later… professional to the bone.
Participant from a Debugging, tracing, profiling and performance analysis on-site course in October 2023
The training was great, gave some ideas what I could use and improve about my workflow and many useful information. I had a good time as well. Thanks to Alexis who is a fantastic trainer!
Participant from a Debugging, tracing, profiling and performance analysis on-site course in October 2023
- In 2023, 90.7% of the participants were very satisfied with the course, giving a score equal or higher to 8 as the overall rating for our course, on 10 points
- In 2023, 99.1% of the participants got their training certificate, by having more than 50% of correct answers to our final quiz
By the way, you can also see evaluations from previous sessions. In the same way we are transparent with our training materials, we share all the evaluations that we collect, not only the best ones.
Participants with disabilities
Participants with disabilities who have special needs are invited to contact us to discuss adaptations to the training course.
Contact
For any question, registration or comment, you can contact us:
- training@bootlin.com
- phone : +33 484 258 097