After showing how to build a minimal Linux system for the STM32MP157 platform, how to connect and use an I2C based pressure/temperature/humidity sensor and how to integrate Qt5 in our system, how to set up a development environment to write our own Qt5 application, we are finally going to write our Qt5 application.
List of articles in this series:
- Building a Linux system for the STM32MP1: basic system
- Building a Linux system for the STM32MP1: connecting an I2C sensor
- Building a Linux system for the STM32MP1: enabling Qt5 for graphical applications
- Building a Linux system for the STM32MP1: setting up a Qt5 application development environment
- Building a Linux system for the STM32MP1: developing a Qt5 graphical application
- Building a Linux system for the STM32MP1: implementing factory flashing
- Building a Linux system for the STM32MP1: remote firmware updates
Disclaimer
Before we get started in this blog post, it is important to mention that it is not meant to be a full introduction to programming applications with Qt5. This would require much more than a blog post, and the Qt web site has extensive documentation.
Also, we want to make it clear that Bootlin’s core expertise is in low-level embedded Linux development, not in Qt application development. Therefore, our example application may not show the best practices in terms of Qt development. We welcome comments and suggestions from our readers to improve the example used in this blog post.
Reading sensor data
As we’ve seen in a previous article, the sensor data is available by reading the following files:
/sys/bus/iio/devices/iio:device2/in_temp_inputfor the temperature/sys/bus/iio/devices/iio:device2/in_pressure_inputfor the pressure/sys/bus/iio/devices/iio:device2/in_humidityrelative_inputfor the humidity
So what we will do is writing a new class called DataProvider, which will read those files once per second, and emit a signal with the 3 values every second. Slots and signals is a fundamental mechanism in Qt, which allows to connect emitters of events to receivers for those events. In our case, the DataProvider class will emit a signal when new sensor values are read, while another class in charge of the graphical UI will receive those signals.
At this step, we don’t yet have a graphical UI, so we’ll simply add a few debugging messages in the DataProvider to make sure it works as expected.
Let’s start by adding a data-provider.h file to our project:
#ifndef DATA_PROVIDER_H
#define DATA_PROVIDER_H

#include <QtCore/QTimer>

class DataProvider: public QObject
{
    Q_OBJECT

public:
    DataProvider();

private slots:
    void handleTimer();

signals:
    void valueChanged(float temp, float pressure, float humidity);

private:
    QTimer timer;
};

#endif /* DATA_PROVIDER_H */
It creates a very simple class than inherits from QObject, with:
- A constructor
- A private slot
handleTimerwhich will be used internally by the class QTimer’s instance to notify that a timer has expired. This is what will allow us to poll the sensor values every second. - A
valueChangedsignal, which will be emitted by the class every time new sensor values are available.
Then, the implementation of this class in data-provider.cpp is fairly straight-forward:
#include <QtCore/QFile>
#include <QDebug>
#include "data-provider.h"

DataProvider::DataProvider()
{
    QObject::connect(&timer, &QTimer::timeout,
		     this, &DataProvider::handleTimer);
    timer.setInterval(1000);
    timer.start();
}

void DataProvider::handleTimer()
{
    QFile temp_f("/sys/bus/iio/devices/iio:device2/in_temp_input");
    QFile pressure_f("/sys/bus/iio/devices/iio:device2/in_pressure_input");
    QFile humidity_f("/sys/bus/iio/devices/iio:device2/in_humidityrelative_input");

    if (!temp_f.open(QIODevice::ReadOnly | QIODevice::Text))
        return;
    if (!pressure_f.open(QIODevice::ReadOnly | QIODevice::Text))
        return;
    if (!humidity_f.open(QIODevice::ReadOnly | QIODevice::Text))
        return;

    float temp = QString(temp_f.readAll()).toDouble() / 1000;
    float pressure = QString(pressure_f.readAll()).toDouble() * 10;
    float humidity = QString(humidity_f.readAll()).toDouble() / 1000;

    qDebug() << "Temperature: " << temp << "Pressure: " << pressure << "Humidity: " << humidity;

    emit valueChanged(temp, pressure, humidity);
}
The constructor of the class connects the QTimer::timeout signal of the QTimer to this class handlerTimer slot, sets the timer interval to 1000 milliseconds, and starts the timer. This is what will ensure the handleTimer method gets called every second.
In the handleTimer method, we open the 3 files in sysfs, read their value and convert them to meaningful units: the temperature in Celcius, the pressure in hPA, and the humidity in percent. We then print a debugging message and emit the signal with the three values.
With this in place, we need to make sure those two files are properly taken into account by our project, by changing the .pro file as follows:
QT += widgets
SOURCES = main.cpp data-provider.cpp
HEADERS = data-provider.h
INSTALLS += target
target.path = /usr/bin
The data-provider.cpp file was added to SOURCES, while data-provider.h was added to the new HEADERS.
Now, we just need to change main.cpp to instantiate one DataProvider object:
#include <QApplication>
#include <QPushButton&ht;
#include "data-provider.h"

int main(int argc, char* argv[])
{
    QApplication app(argc, argv);
    QPushButton hello("Hello world!");
    DataProvider dp;
    hello.resize(100,30);
    hello.show();
    return app.exec();
}
With this, you can now build and run the application, and you should see every second the debugging message showing the temperature, pressure and humidity values:
# qt-sensor-demo -platform linuxfb
Temperature:  28.12  Pressure:  1003.08  Humidity:  32.235
Temperature:  28.12  Pressure:  1003.07  Humidity:  32.246
Temperature:  28.12  Pressure:  1003.06  Humidity:  32.256
Temperature:  28.12  Pressure:  1003.08  Humidity:  32.267
Displaying sensor data
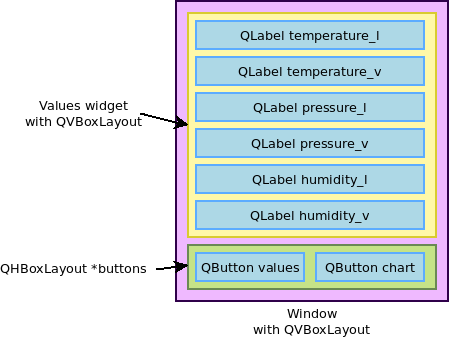
We now want to display the sensor data. For this, we'll create a UI with two panels, one to display the numeric value of the temperature, humidity and pressure, and another panel with a chart of the temperature. At the bottom of the screen, two buttons Values and Chart will allow to switch between both panels.
So, we'll create a Window class to encapsulate the overall window layout and behavior, and a Values class providing the widget showing the 3 values. We'll leave the chart implementation to the next section. To help you follow the code in this section, here is a diagram that shows the different widgets and how they will be grouped together in our user interface:
Let's start by implementing the Values widget, which will be used to show the 3 numeric values, one below each other. The values.h file will look like this:
#ifndef VALUES_H
#define VALUES_H

#include <QWidget>

class QLabel;

class Values : public QWidget
{
    Q_OBJECT

public:
    Values();

public slots:
    void handleValueChanged(float temp, float pressure, float humidity);

private:
    QLabel *temperature_v;
    QLabel *pressure_v;
    QLabel *humidity_v;
};

#endif /* VALUES_H */
So it has a simple constructor, a slot to be notified of new values available, and 3 text labels to display the 3 values. The implementation in values.cpp is:
// SPDX-License-Identifier: MIT
#include <QtWidgets>
#include "values.h"

Values::Values()
{
    QVBoxLayout *layout = new QVBoxLayout;

    QLabel *temperature_l = new QLabel(tr("Temperature (°C)"));
    QLabel *pressure_l = new QLabel(tr("Pressure (hPa)"));
    QLabel *humidity_l = new QLabel(tr("Humidity (%)"));

    temperature_v = new QLabel();
    pressure_v = new QLabel();
    humidity_v = new QLabel();

    QFont f = temperature_v->font();
    f.setPointSize(28);
    f.setBold(true);
    temperature_v->setFont(f);
    pressure_v->setFont(f);
    humidity_v->setFont(f);
    temperature_v->setAlignment(Qt::AlignRight | Qt::AlignVCenter);
    pressure_v->setAlignment(Qt::AlignRight | Qt::AlignVCenter);
    humidity_v->setAlignment(Qt::AlignRight | Qt::AlignVCenter);

    layout->addWidget(temperature_l);
    layout->addWidget(temperature_v);
    layout->addWidget(pressure_l);
    layout->addWidget(pressure_v);
    layout->addWidget(humidity_l);
    layout->addWidget(humidity_v);

    setLayout(layout);
}

void Values::handleValueChanged(float temp, float pressure, float humidity)
{
    temperature_v->setText(QString::number(temp, 'f', 2));
    pressure_v->setText(QString::number(pressure, 'f', 1));
    humidity_v->setText(QString::number(humidity, 'f', 1));
}
The constructor creates 3 text labels for the legends ("Temperature (°C)", "Pressure (hPA)" and "Humidity (%)"), then instantiates the 3 text labels for the values themselves. It sets up the font and text alignment properties for those labels, and then adds all widgets in a QVBoxLayout so that they all appear vertically below each other.
The handleValueChanged slot simply updates the text labels contents with the new sensor values, doing the proper text formatting on the way.
With the Values class implemented, we can now implement the main Window class. The window.h will contain:
#ifndef WINDOW_H
#define WINDOW_H

#include <QWidget>

class Values;

class Window : public QWidget
{
    Q_OBJECT

public slots:
    void handleValueChanged(float temp, float pressure, float humidity);

public:
    Window();

private:
    Values *values;
};

#endif
Beyond a simple constructor, it has a slot Values widget instance.
The implementation in window.cpp is as follows:
#include <QtWidgets>

#include "window.h"
#include "values.h"

Window::Window()
{
    values = new Values;
    QVBoxLayout *layout = new QVBoxLayout;
    QHBoxLayout *buttons = new QHBoxLayout;

    QPushButton *values_button = new QPushButton("Values");
    QPushButton *chart_button = new QPushButton("Chart");

    buttons->addWidget(values_button);
    buttons->addWidget(chart_button);

    layout->addWidget(values);
    layout->addLayout(buttons);

    setLayout(layout);

    setWindowTitle(tr("Sensors"));
}

void Window::handleValueChanged(float temp, float pressure, float humidity)
{
    values->handleValueChanged(temp, pressure, humidity);
}
The constructor creates a horizontal layout QHBoxLayout with two buttons: Values and Chart. Those will be used in the next section to switch between the Values panel and the Chart panel. For now, they don't do anything.
Then, the constructor adds the Value widget, and the horizontal layout box with the buttons into a vertical box layout, assigns the main window layout and defines the window title.
The handleValueChanged slot implementation just forwards the call to the Values::handleValueChanged method.
Now, obviously main.cpp needs to be changed: instead of creating a button, we'll create our window, and do a bit of additional setup:
#include <QApplication>
#include "window.h"
#include "data-provider.h"

int main(int argc, char* argv[])
{
    QApplication app(argc, argv);
    DataProvider dp;
    Window window;

    QObject::connect(&dp, &DataProvider::valueChanged,
		     &window, &Window::handleValueChanged);

    window.setFixedSize(480, 800);
    window.setStyleSheet("background-color: white;");
    window.show();
    return app.exec();
}
So, not only we create the Window, but more importantly, we connect the valueChanged signal of DataProvider to the handleValueChanged slot of Window. We define the window size (which is fixed, to match the STM32MP15 Discovery board panel) and set the background color of the application.
Obviously, the qt-sensor-demo.pro file needs to be adjusted to build our new files. It now looks like this:
QT += widgets
SOURCES = main.cpp data-provider.cpp window.cpp values.cpp
HEADERS = data-provider.h window.h values.h
INSTALLS += target
target.path = /usr/bin
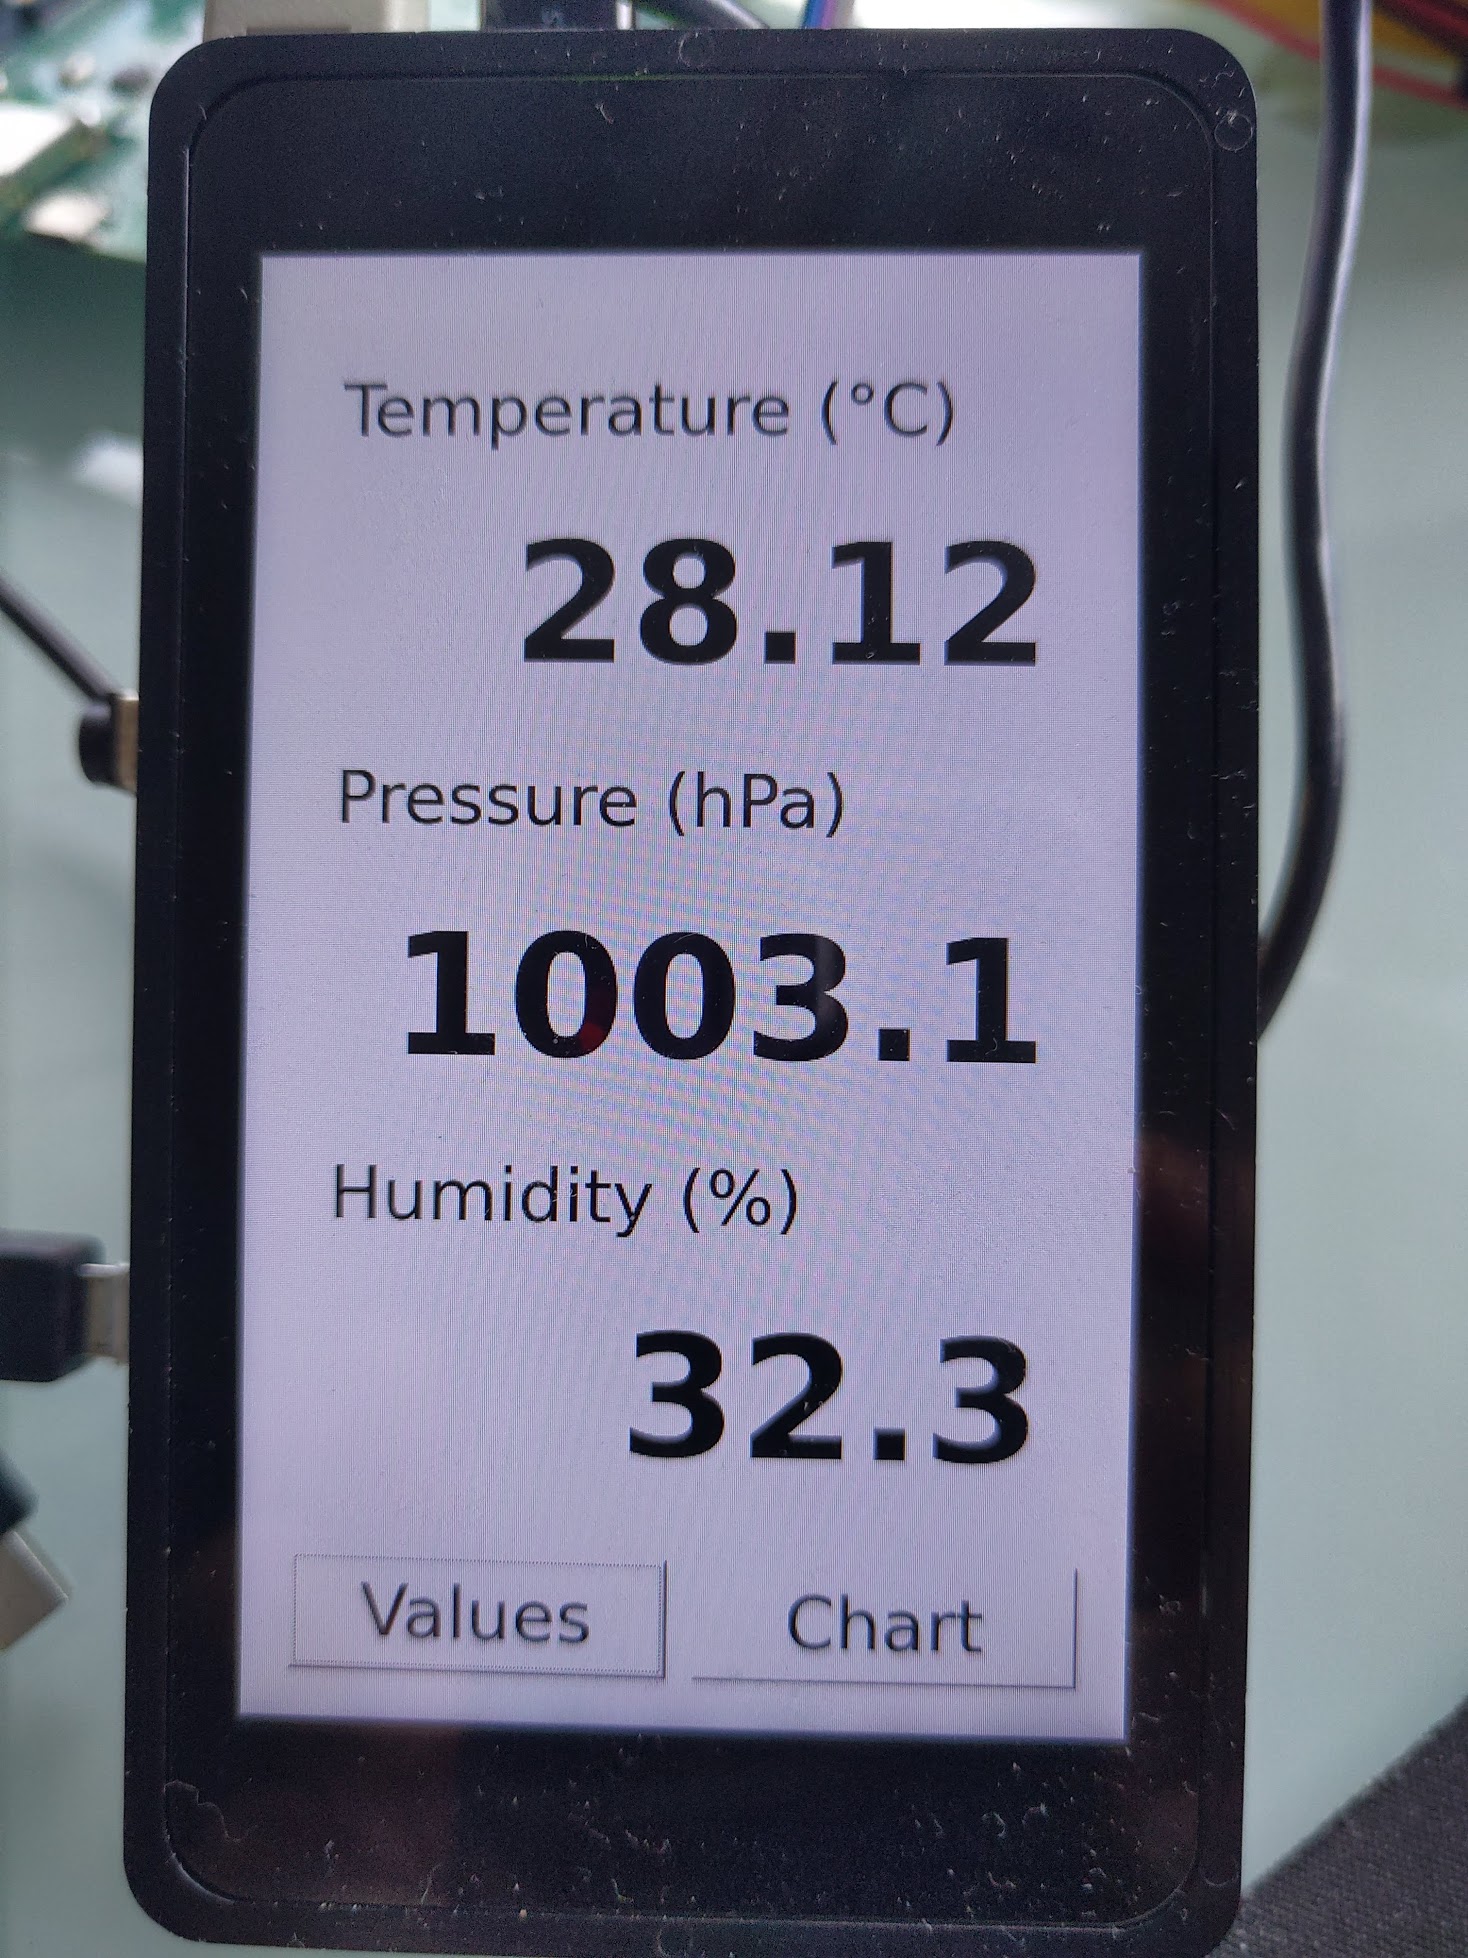
With this done, we can run the Qt5 application on our target, and see:
Graphing the temperature
The final part of developing our application is to implement a graph showing the evolution of temperature over time. For this, we are going to use the very convenient Qt Charts module, which is available in a separate Qt module from the base of Qt.
To implement the graph widget itself, we'll create a new Chart class:
#ifndef CHART_H
#define CHART_H

#include <QtCharts/QChart>

QT_CHARTS_BEGIN_NAMESPACE
class QSplineSeries;
class QValueAxis;
QT_CHARTS_END_NAMESPACE

QT_CHARTS_USE_NAMESPACE

class Chart: public QChart
{
    Q_OBJECT

public:
    Chart(QGraphicsItem *parent = 0, Qt::WindowFlags wFlags = 0);

public slots:
    void handleValueChanged(float temp, float pressure, float humidity);

private:
    QSplineSeries *m_series;
    QStringList m_titles;
    QValueAxis *m_axisX;
    QValueAxis *m_axisY;
    int xpos;
};

#endif /* CHART_H */
This class inherits from the QChart class provided by Qt. It provides a constructor and destructor, a slot that allows to receive notification of new sensor values, and it has a number of private variables to manage the chart itself.
Let's go through the implementation of this class now:
#include "chart.h"
#include <QtCharts/QAbstractAxis>
#include <QtCharts/QSplineSeries>
#include <QtCharts/QValueAxis>

Chart::Chart(QGraphicsItem *parent, Qt::WindowFlags wFlags):
    QChart(QChart::ChartTypeCartesian, parent, wFlags),
    m_series(0),
    m_axisX(new QValueAxis()),
    m_axisY(new QValueAxis()),
    xpos(0)
{
    m_series = new QSplineSeries(this);
    QPen pen(Qt::red);
    pen.setWidth(2);
    m_series->setPen(pen);
    m_series->append(xpos, 30);

    addSeries(m_series);

    addAxis(m_axisX,Qt::AlignBottom);
    addAxis(m_axisY,Qt::AlignLeft);
    m_series->attachAxis(m_axisX);
    m_series->attachAxis(m_axisY);
    m_axisX->setTickCount(5);
    m_axisX->setRange(0, 60);
    m_axisY->setRange(0, 50);

    QFont f = m_axisX->labelsFont();
    f.setPointSize(8);
    m_axisX->setLabelsFont(f);
    m_axisY->setLabelsFont(f);

    setMargins(QMargins(0,0,0,0));

    setTitle("Temperature (°C)");
    legend()->hide();
}

void Chart::handleValueChanged(float temp, float pressure, float humidity)
{
    Q_UNUSED(pressure);
    Q_UNUSED(humidity);
    m_series->append(xpos, temp);
    xpos++;
    if (xpos >= 60)
      scroll(plotArea().width() / 60, 0);
}
The constructor simply sets up the QChart we inherit from: defining the axis, their range, the pen width and color, etc. On the X axis (time), we are going to show 60 measurements, and since our handleValueChanged slot is going to be called every second, it means our graph will show the last 60 seconds of temperature measurement. On the Y axis (temperature), we can show temperatures from 0°C to 50°C. Of course, this is all very hardcoded in this example, for simplicity.
The handleValueChanged slot appends the new temperature value to the graph, and then updates the area displayed by the graph so that always the last 60 seconds are visible.
Now, we need to integrate this to our existing Window class, so that we can display the chart, and switch between the numeric values and the chart. First, we need to do some changes in window.h, and below we'll show only the diff to make the differences very clear:
diff --git a/window.h b/window.h
index 3d63d38..05d1f39 100644
--- a/window.h
+++ b/window.h
@@ -3,8 +3,12 @@
 #define WINDOW_H

 #include <QWidget>
+#include <QtCharts/QChartView>
+
+QT_CHARTS_USE_NAMESPACE

 class Values;
+class Chart;

 class Window : public QWidget
 {
@@ -13,11 +17,17 @@ class Window : public QWidget
 public slots:
     void handleValueChanged(float temp, float pressure, float humidity);

+private slots:
+    void chartButtonClicked();
+    void valuesButtonClicked();
+
 public:
     Window();

 private:
     Values *values;
+    QChartView *chartView;
+    Chart *chart;
 };

 #endif
So, we're defining two private slots that will be used for the two buttons that allow to switch between the numeric values and the chart, and then we add two variables, one for the chart itself, and one for the QChartView (which basically renders the graph into a widget).
Then, in window.cpp, we do the following changes:
diff --git a/window.cpp b/window.cpp
index aba2862..d654964 100644
--- a/window.cpp
+++ b/window.cpp
@@ -3,28 +3,54 @@

 #include "window.h"
 #include "values.h"
+#include "chart.h"

 Window::Window()
 {
     values = new Values;
+    chart = new Chart;
     QVBoxLayout *layout = new QVBoxLayout;
     QHBoxLayout *buttons = new QHBoxLayout;

     QPushButton *values_button = new QPushButton("Values");
     QPushButton *chart_button = new QPushButton("Chart");

+    QObject::connect(chart_button, &QPushButton::clicked,
+                    this, &Window::chartButtonClicked);
+    QObject::connect(values_button, &QPushButton::clicked,
+                    this, &Window::valuesButtonClicked);
+
     buttons->addWidget(values_button);
     buttons->addWidget(chart_button);

+    chartView = new QChartView(chart);
+    chartView->setRenderHint(QPainter::Antialiasing);
+
     layout->addWidget(values);
+    layout->addWidget(chartView);
     layout->addLayout(buttons);

     setLayout(layout);

+    chartView->hide();
+
     setWindowTitle(tr("Sensors"));
 }

 void Window::handleValueChanged(float temp, float pressure, float humidity)
 {
     values->handleValueChanged(temp, pressure, humidity);
+    chart->handleValueChanged(temp, pressure, humidity);
+}
+
+void Window::chartButtonClicked()
+{
+    values->hide();
+    chartView->show();
+}
+
+void Window::valuesButtonClicked()
+{
+    values->show();
+    chartView->hide();
 }
So, in the constructor we are connecting the clicked signals of the two buttons to their respective slots. We create the Chart object, and then the QChartView to render the graph. We add the latter as an additional widget in the QVBoxLayout, and we hide it.
The existing handleValueChanged slot is modified to also update the Chart object with the new sensor values.
Finally, the new chartButtonClicked and valuesButtonClicked slots implement the logic that is executed when the buttons are pressed. We simply hide or show the appropriate widget to display either the numeric values or the chart. There is probably a nicer way to achieve this in Qt, but this was good enough for our example.
Now that the source code is in place, we of course need to adjust the build logic in qt-sensor-demo.pro:
--- a/qt-sensor-demo.pro
+++ b/qt-sensor-demo.pro
@@ -1,6 +1,6 @@
 # SPDX-License-Identifier: MIT
-QT += widgets
-SOURCES = main.cpp data-provider.cpp window.cpp values.cpp
-HEADERS = data-provider.h window.h values.h
+QT += widgets charts
+SOURCES = main.cpp data-provider.cpp window.cpp values.cpp chart.cpp
+HEADERS = data-provider.h window.h values.h chart.h
 INSTALLS += target
 target.path = /usr/bin
Besides the obvious addition of the chart.cpp and chart.h file, the other important addition is charts to the QT variable. This tells qmake that our application is using the Qt Charts, and that we therefore need to link against the appropriate libraries.
Building the application
At this point, if you try to build the application, it will fail because QtCharts has not been built as part of our Buildroot configuration. In order to address this, run Buildroot's make menuconfig, enable the BR2_PACKAGE_QT5CHARTS option (in Target packages -> Graphic libraries and applications -> Qt5 -> qt5charts).
Then, run the Buildroot build with make, and reflash the resulting SD card image.
Now, you can build again your application, either with Qt Creator if you've been using Qt Creator, or manually. If you build it manually, you'll have to run qmake again to regenerate the Makefile, and then build with make.
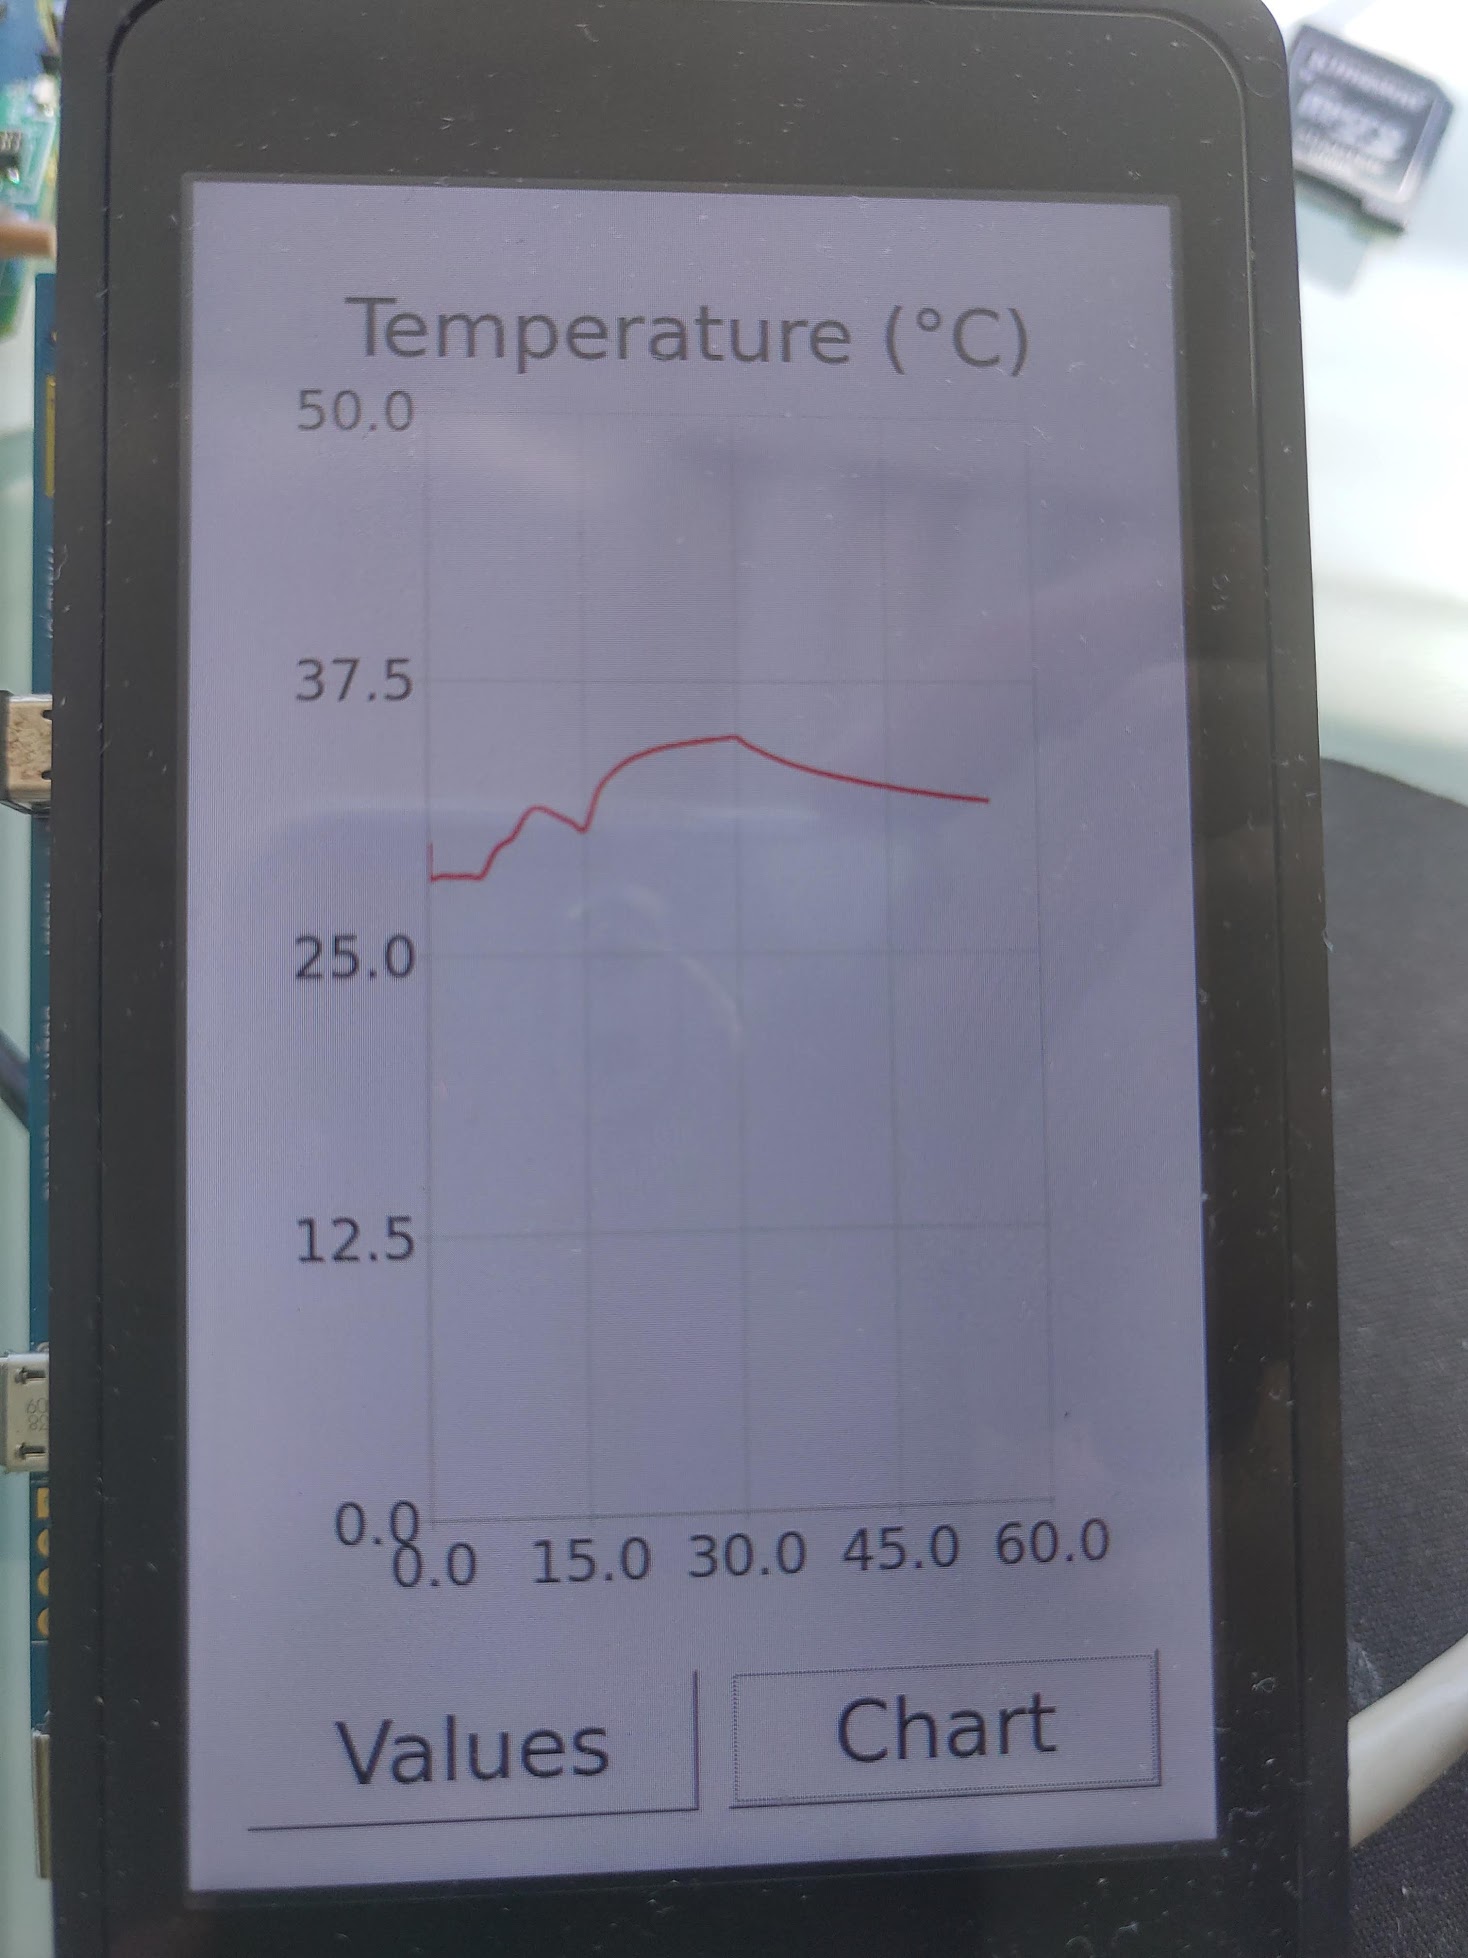
When you run the application on the target, the GUI will display the same numeric values as before, but now if you press the Chart button, it will show something like:
Adjusting the Buildroot package
We have for now been building this application manually, but as explained in our previous blog post, we really want Buildroot to be able to build our complete system, including our application. For this reason, we had created a qt-sensor-demo package, which gets our application source code, configures it with qmake, builds it and installs it.
However, with the new use of Qt Charts, our qt-sensor-demo package needs a few adjustements:
- The
Config.infile needs an additionalselect BR2_PACKAGE_QT5CHARTS, to make sure Qt Charts are enabled in the Buildroot configuration - The
qt-sensor-demo.mkfile needs an additionalqt5chartsin theQT_SENSOR_DEMO_DEPENDENCIESvariable to make sure the qt5charts package gets built before qt-sensor-demo
With this in place, you can run:
make qt-sensor-demo-rebuild
make
And you have an SD card image that includes our application!
Starting the application automatically at boot time
The next and almost final step for this blog post is to get our application automatically started at boot time. We can simply add a small shell script on the target in /etc/init.d/: the default Buildroot configuration for the init system will execute all scripts named Ssomething in /etc/init.d/. We'll add a file named package/qt-sensor-demo/S99qt-sensor-demo with these contents:
#!/bin/sh

DAEMON="qt-sensor-demo"
DAEMON_ARGS="-platform linuxfb"
PIDFILE="/var/run/qt-sensor-demo.pid"

start() {
	printf 'Starting %s: ' "$DAEMON"
	start-stop-daemon -b -m -S -q -p "$PIDFILE" -x "/usr/bin/$DAEMON" -- $DAEMON_ARGS
	status=$?
	if [ "$status" -eq 0 ]; then
		echo "OK"
	else
		echo "FAIL"
	fi
	return "$status"
}

stop () {
	printf 'Stopping %s: ' "$DAEMON"
	start-stop-daemon -K -q -p "$PIDFILE"
	status=$?
	if [ "$status" -eq 0 ]; then
		rm -f "$PIDFILE"
		echo "OK"
	else
		echo "FAIL"
	fi
	return "$status"
}

restart () {
	stop
	sleep 1
	start
}

case "$1" in
        start|stop|restart)
		"$1";;
	reload)
		# Restart, since there is no true "reload" feature.
		restart;;
        *)
                echo "Usage: $0 {start|stop|restart|reload}"
                exit 1
esac
This is the canonical init script used in Buildroot to start system daemons and services, and is modeled after the one in package/busybox/S01syslogd. It uses the start-stop-daemon program to start our application in the background.
Then, to get this init script installed, we need to adjust package/qt-sensor-demo/qt-sensor-demo.mk with the following additional lines:
define QT_SENSOR_DEMO_INSTALL_INIT_SYSV
        $(INSTALL) -D -m 755 package/qt-sensor-demo/S99qt-sensor-demo \
                $(TARGET_DIR)/etc/init.d/S99qt-sensor-demo
endef
This ensures that the init script gets installed in /etc/init.d/S99qt-sensor-demo as part of the build process of our qt-sensor-demo package. Note that an init script works fine if you're using the Busybox init implementation or the sysvinit init implementation (we're using the default Buildroot setup here, which uses the Busybox init implementation). If you want to use systemd as an init implementation, then a different setup is necessary.
With this done, you simply need to reinstall the application and regenerate the SD card image
$ make qt-sensor-demo-reinstall
$ make
You can now test your SD card image on you board, and you should see the application being started automatically, with the following messages at boot time
Starting dropbear sshd: OK
Starting qt-sensor-demo: OK

Welcome to Buildroot
Avoid unnecessary logging on the display panel
In our current setup, the kernel messages are being sent to both the serial port and the framebuffer console, which means they appear on the display panel. This is not very pretty, and we would like the display to remain black until the application starts, while keeping the kernel messages on the serial port for debugging purposes. Also, we would like the framebuffer console text cursor to not be displayed, to really have a fully black screen. To achieve this we will add two arguments on the Linux kernel command line:
console=ttySTM0,115200, which will tell the Linux kernel to only use the serial port as the console, and not all registered consoles, which would include the framebuffer console. This option will make sure the kernel messages are not displayed on the screen.vt.global_cursor_default=0, which will tell the Linux kernel to not display any cursor on the framebuffer console.
So, to add those options, we simply modify board/stmicroelectronics/stm32mp157-dk/overlay/boot/extlinux/extlinux.conf in Buildroot as follows:
label stm32mp15-buildroot
  kernel /boot/zImage
  devicetree /boot/stm32mp157c-dk2.dtb
  append root=/dev/mmcblk0p4 rootwait console=ttySTM0,115200 vt.global_cursor_default=0
Of course, rebuild the SD card image with make, reflash and test the result on your STM32MP1 platform.
Conclusion
In this blog post, we have seen how to write a real (but admittedly very simple) Qt application, how to make it read and display sensor data, and how to integrate this application so that it gets started at boot time.
You can find the Buildroot changes corresponding to this blog post in the 2019.02/stm32mp157-dk-blog-5 branch of our repository. The qt-sensor-demo application code can be found in the blog-5 branch of this application Git repository.
Stay tuned for our next blog post about factory flashing and OTA update!
thank you,
I have a question independent from the context.
DId you ever tested low power feature with builroot image ?
I tested and failed both with offical basic trusted image and this buildroot trusted image.
My M4 program and my A7 (qt) program are running together.
While they are running together, I enabled waking up with “echo enabled > /sys/devices/platform/soc/4c001000.mailbox/power/wakeup” and then I put A7 in low power mode with
“echo mem > /sys/power/state”. I adjusted M4 program so that it sends a message over OpenAmp (/dev/ttyRPMSG0) while A7 is sleeping. M4 has sent the message but A7 didn’t wake up. It says in wiki page “if A7 receives something from console, it will wake up”.
If I ever manage to do it, I will add a low power push button to my qt-program.
Am I doing something false ?
thank you very much !
Hello Ibrahim. We have not (yet ?) investigated this aspect of putting the A7 in low-power state and waking it up from the M4. If you’re interested in commercial support/engineering in this area, do not hesitate to contact us.
Hi,
which buildroot file is enough to build the same buildroot system from scratch ?
Just the file .config ?
Hello Mark. Please see the conclusion of the blog post, it points to the Git branch at https://github.com/tpetazzoni/buildroot/tree/2019.02/stm32mp157-dk-blog-5, which is a Buildroot with all the modifications that allow to reproduce what was done in this blog post. This branch contains a number of commits that you can read to learn what changes were done.
Hi!
First, thank you for your post!
I have a problem with using an opensource project openSCADA. I integrated it to buildroot and building of it is ok. But when I try to start it on board I have next error:
qt.qpa.plugin: Could not find the Qt platform plugin “eglfs” in “”
This application failed to start because no Qt platform plugin could be initialized. Reinstalling the application may fix this problem.
Available platform plugins are: linuxfb, minimal, offscreen, vnc.
So, I hope you can help me to solve it.
Thank you!
Hello Vlad. Thanks for your comment.
First of all, if you have packaged openSCADA for Buildroot, could you please submit your Buildroot packages to the official Buildroot project ? This may be useful for others.
Regarding the Qt5 error. Qt has multiple graphics backend. In this series of blog post, I’m using the minimal linuxfb backend, which works but doesn’t provide any HW acceleration. Here, it seems like you’re trying to use the eglfs graphics backend, which requires OpenGL support. OpenGL support for STM32MP1 was added to Buildroot after 2019.02, so if you use a newer release such as the lates 2020.02, you will be able to enable the gcnano-binaries, and then enable OpenGL support in Qt, which will provide the eglfs backend.