
 Even if the presence of Rust is slowly increasing in the Linux kernel code base, the project largely remains written in C, and while this is the de facto language to write low level code, it unfortunately also comes with a significant ability of making mistakes, with the corresponding failures then coming in a wide variety of shapes: undefined behaviors, buffer overflows, segmentation faults… The kernel is not immune to such issues, and so kernel developers need some dedicated tooling to catch those issues early. As many problems have their roots in memory management, one tool that can legitimately sit in any kernel hacker toolbox is the Kernel Address Sanitizer, or KASAN for short. This blog does not aim to teach readers how to use KASAN: the kernel documentation is pretty explicit on this matter. We are rather going to explore KASAN internals, mostly to understand its impact (both at build time and at runtime), but up to some extent, to appreciate the elegant engineering involved in its implementation!
The Kernel Address Sanitizer
KASAN is a runtime checker implemented in the kernel, allowing to catch two kinds of memory manipulation mistakes: out-of-bounds accesses and use-after-free. This tooling has to be explicitly enabled at kernel build time, as it actually depends on two main parts:
- some build time instrumentation inserted by the compiler: GCC or LLVM inserts some additional code in front of all memory-accessing instructions, thanks to the Address Sanitizer library.
- But that’s not the only component: this additional instrumentation then needs a way to distinguish memory accesses that are legitimate from those that are invalid. To achieve this, KASAN relies on some special memory called the shadow memory, maintained by the kernel to track the whole memory it is able to use.
Enabling KASAN is pretty easy: we mostly need to enable CONFIG_KASAN and to rebuild our kernel. KASAN also comes with a few parameters that we can tune:
- the inserted instrumentation can be inlined or outlined, depending on the trade-offs we can afford
- some hardware support can be enabled (if our architecture supports it) to reduce KASAN overhead, like software tags and hardware tags
- we can tune which kind of memory is tracked (vmalloc memory, stack memory, etc)
With the goal of learning and experimenting with KASAN support, we definitely want a basic setup allowing to run a test kernel in a virtualized environment: as we may end up performing wrong memory accesses, we don’t want to crash our host kernel. There are multiple solutions to bring up such a setup; using virtme-ng from Andrea Righi surely is one of the easiest solutions. Here is a very basic setup workflow to get familiar with KASAN reports:
$ git clone https://git.kernel.org/pub/scm/linux/kernel/git/stable/linux.git
$ cd linux && git checkout linux-7.1.y
$ vng -b \
  --configitem CONFIG_KASAN=y \
  --configitem CONFIG_KUNIT=y \
  --configitem CONFIG_KASAN_KUNIT_TEST=m
$ vng --user root
With this basic list of commands, we are asking virtme-ng to configure and build a kernel with basic KASAN support and the corresponding kunit tests embedded. The final vng command starts this kernel in a QEMU environment emulating the same architecture as for the host used to build the kernel, and with a minimal rootfs. Once booted, we can generate and study KASAN reports by loading the corresponding test kernel module:
# modprobe kasan_test
# dmesg
The kernel log buffer now contains plenty of KASAN reports related to faulty memory accesses, such as this one:
==================================================================
BUG: KASAN: slab-out-of-bounds in kmalloc_oob_right+0x705/0x7d0 [kasan_test]
Write of size 1 at addr ffff888005fa5f73 by task kunit_try_catch/249

CPU: 2 UID: 0 PID: 249 Comm: kunit_try_catch Tainted: G N 7.1.2-virtme #6 PREEMPT(lazy)
Tainted: [N]=TEST
Hardware name: Bochs Bochs, BIOS Bochs 01/01/2011
Call Trace:
<TASK>
dump_stack_lvl+0x4d/0x70
print_report+0x14b/0x4b0
? __pfx__raw_spin_lock_irqsave+0x10/0x10
kasan_report+0x119/0x140
? kmalloc_oob_right+0x705/0x7d0 [kasan_test]
? kmalloc_oob_right+0x705/0x7d0 [kasan_test]
kmalloc_oob_right+0x705/0x7d0 [kasan_test]
? __pfx_kmalloc_oob_right+0x10/0x10 [kasan_test]
? dequeue_task_fair+0x14d/0x6c0
? kvm_clock_get_cycles+0x18/0x30
? ktime_get_ts64+0x1ce/0x380
kunit_try_run_case+0x1a0/0x2c0
? __pfx_kunit_try_run_case+0x10/0x10
? kthread_affine_node+0x1e6/0x2d0
? __pfx_kunit_generic_run_threadfn_adapter+0x10/0x10
kunit_generic_run_threadfn_adapter+0x85/0xf0
kthread+0x329/0x410
? recalc_sigpending+0x162/0x210
? __pfx_kthread+0x10/0x10
ret_from_fork+0x289/0x580
? __pfx_ret_from_fork+0x10/0x10
? __switch_to+0x585/0xf70
? __pfx_kthread+0x10/0x10
ret_from_fork_asm+0x1a/0x30
</TASK>

Allocated by task 249:
kasan_save_stack+0x2f/0x50
kasan_save_track+0x14/0x30
__kasan_kmalloc+0x7f/0x90
kmalloc_oob_right+0xae/0x7d0 [kasan_test]
kunit_try_run_case+0x1a0/0x2c0
kunit_generic_run_threadfn_adapter+0x85/0xf0
kthread+0x329/0x410
ret_from_fork+0x289/0x580
ret_from_fork_asm+0x1a/0x30

The buggy address belongs to the object at ffff888005fa5f00
which belongs to the cache kmalloc-128 of size 128
The buggy address is located 0 bytes to the right of
allocated 115-byte region [ffff888005fa5f00, ffff888005fa5f73)

The buggy address belongs to the physical page:
page: refcount:0 mapcount:0 mapping:0000000000000000 index:0x0 pfn:0x5fa4
head: order:1 mapcount:0 entire_mapcount:0 nr_pages_mapped:0 pincount:0
flags: 0x80000000000040(head|node=0|zone=1)
page_type: f5(slab)
raw: 0080000000000040 ffff888001042a00 dead000000000100 dead000000000122
raw: 0000000000000000 0000000000200020 00000000f5000000 0000000000000000
head: 0080000000000040 ffff888001042a00 dead000000000100 dead000000000122
head: 0000000000000000 0000000000200020 00000000f5000000 0000000000000000
head: 0080000000000001 ffffffffffffff81 00000000ffffffff 00000000ffffffff
head: 0000000000000000 0000000000000000 00000000ffffffff 0000000000000000
page dumped because: kasan: bad access detected

Memory state around the buggy address:
ffff888005fa5e00: 00 00 00 00 00 00 00 00 00 00 00 00 00 00 00 fc
ffff888005fa5e80: fc fc fc fc fc fc fc fc fc fc fc fc fc fc fc fc
>ffff888005fa5f00: 00 00 00 00 00 00 00 00 00 00 00 00 00 00 03 fc
^
ffff888005fa5f80: fc fc fc fc fc fc fc fc fc fc fc fc fc fc fc fc
ffff888005fa6000: fa fb fb fb fb fb fb fb fb fb fb fb fb fb fb fb
This reports gives us plenty of information about the nature of the faulty access:
- the first line alone tells us about the exact nature of the faulty access: this is an out-of-bound access on a dynamically allocated buffer. We are also being told that it has been performed by the
kmalloc_oob_rightfunction from thekasan_testmodule, that it was a single byte write, and that the access address was0x0xffff888005fa5f73. - Next we have some more info about the execution context of this faulty access and the platform: the CPU on which it happened, the task that was running, the kernel version, and the platform name
- This is followed by the full call stack for the access
- Finally, depending on the kind of memory, we can have some more specific data: since the faulty access is on a slab-allocated zone, we have the corresponding allocation size, its allocation call stack, the slab cache that has been used to allocate it, and the fact that the 1-byte write was attempted immediately after the valid region (this indeed matches the test code that performs this wrong access).
- If we take a look at the very end of the report, we will see some details about the “memory state” around the memory being accessed: this is not the content of the accessed memory but the value of some specific memory that we need to discuss: the shadow memory used to track the accessed memory state.
KASAN shadow memory
When KASAN is enabled, the kernel will not use the full amount of memory it has access to, it will instead reserve some of this memory to track the state of the rest of the kernel virtual address space: this reserved space is the shadow memory. By default, when using the generic version of KASAN, 1 byte of shadow memory is used to track 8 bytes of kernel memory (those 8 bytes being called a “granule”): this means that 1/8th of the system memory will be used for KASAN tracking when it is enabled.
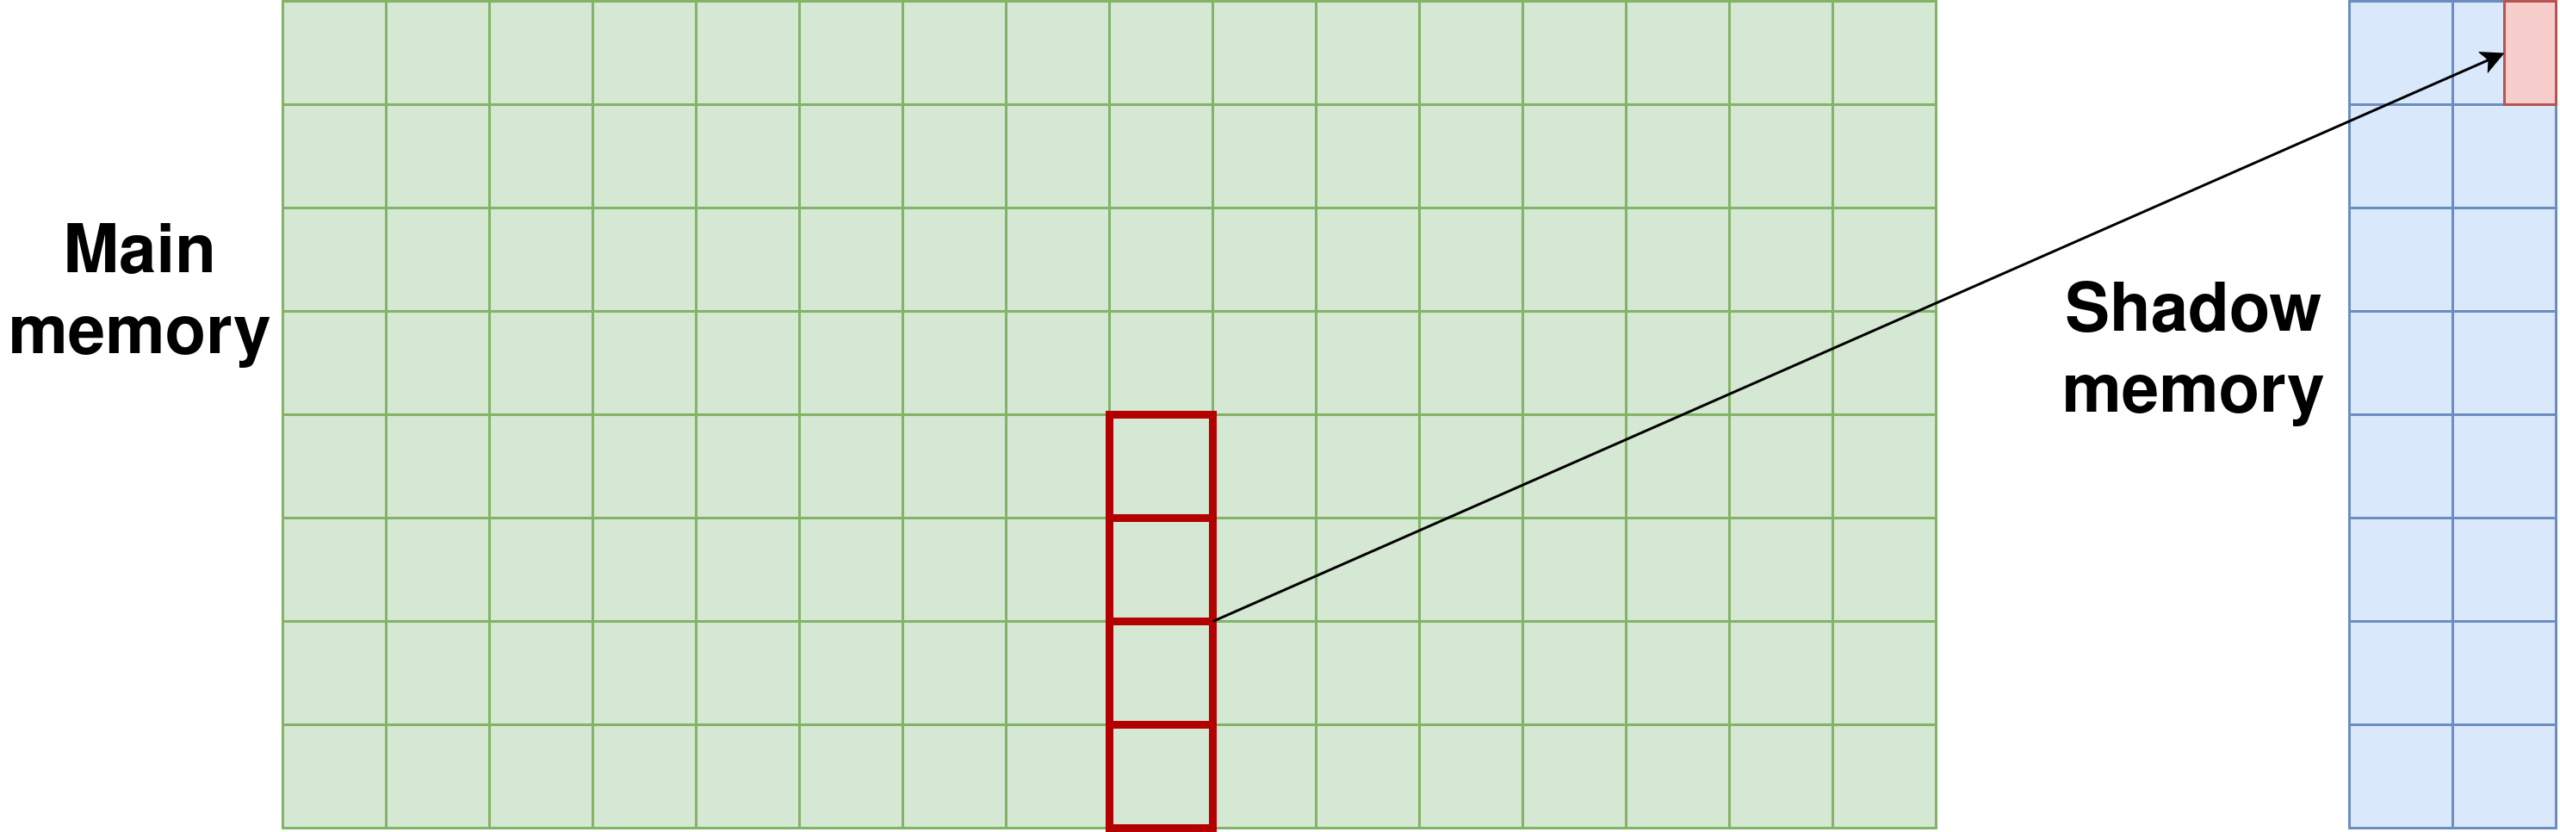
The reserved shadow memory will be set at a specific address in the kernel virtual map, which depends on the architecture. If we take a look for example at the x86_64 memory map, we will see that the shadow memory is mapped at address 0xffffec0000000000. This can be verified on our test kernel by rebuilding it with CONFIG_PTDUMP_DEBUGFS, which allows us to check for the kernel mappings directly from debugfs:
$ make menuconfig #Select CONFIG_PTDUMP_DEBUGFS
$ vng -b
$ vng --user root -- grep -A1 "\[ KASAN shadow \]" \
  /sys/kernel/debug/page_tables/current_kernel
---[ KASAN shadow ]---
0xffffec0000000000-0xffffed1000000000 1088G ro GLB NX pte
As KASAN uses a direct mapping between kernel memory and the corresponding shadow memory, there is a well-defined relationship between an address and its corresponding shadow byte:
shadow_byte = (target_addr >> KASAN_SHADOW_SCALE_SHIFT) + KASAN_SHADOW_OFFSET
The target address is first shifted right by KASAN_SHADOW_SCALE_SHIFT: this is directly related to the granule size (8 bytes, monitored by a single byte), and so despite it being re-defined for each architecture supporting KASAN, this value is always equal to 3 for generic KASAN. This is not enough to get the address of a matching shadow memory though: we must make sure that this computed address falls in the shadow memory range, so we offset it with KASAN_SHADOW_OFFSET. Take care that this value really is an offset, and so it does not point to the KASAN shadow region: this is also the value that is passed to the compiler so that it can correctly emit inlined instrumentation. However, KASAN_SHADOW_OFFSETis used to derive KASAN_SHADOW_START and KASAN_SHADOW_END.
But then, what is the exact meaning of the values that can be found in this shadow memory? First, the value found in a shadow memory byte can be negative: it means that the corresponding granule is not some valid memory area, and so the kernel should not try to access it. Otherwise, the number of bits being set to 0 hints about the number of valid bytes in the granule. If the whole granule is properly allocated and accesses to it are legitimate, then the corresponding shadow byte will be 0x00. But depending on an allocation size, maybe only a fraction of a granule will be valid! In this case, the value of the shadow memory byte indicates what part of the granule is accessible:
0x1: the first byte is accessible, the 7 other bytes should not be accessed0x2: the two first bytes are accessible, the 6 other bytes should not be accessed0x3: the three first bytes are accessible, the 5 other bytes should not be accessed- and so on
So shadow memory allows to track at byte granularity the end of an allocated memory region. Why don’t we have the same granularity for the beginning of a memory region? Because the memory returned by kernel allocators has a minimal alignment which matches the granule size (8 bytes), so the beginning of an allocated region will always match the beginning of a new byte in shadow memory! (see ARCH_KMALLOC_MINALIGN).
So now we know how the shadow memory represents the state of the kernel memory, but we still don’t know yet when it is updated. That’s something that can have been already guessed though: memory tracking is updated when said memory is allocated or de-allocated! We can for example take a look at the kmalloc function in the kernel, and following all the children functions, we will eventually find __do_kmalloc_node, which executes two different steps when updating the shadow memory for the allocated memory:
- it will first call slab_alloc_node, which calls kasan_slab_alloc. Digging further in this function, we will find a call to kasan_unpoison, which in turn calls kasan_poison to set to 0 the shadow memory matching the newly allocated memory
- it will then call kasan_kmalloc, which ends up calling poison_kmalloc_redzone: this one will set the shadow memory for the region immediately after the allocated memory as “inaccessible”.
Those two different paths make us learn a few interesting things: first, there’s a concept of “(un)poisoning” memory. When a KASAN-enabled kernel allocates some memory, it “unpoisons” it, meaning that it resets the corresponding shadow memory to 0. When the memory is freed, it “poisons” it again to mark it back as “inaccessible” (this poisoning is visible in kfree, when it finally calls kasan_poison_slab_object). We can also see there that poisoning does not involve random negative values: depending on the zone being poisoned and the reason for this poisoning, the kernel uses specific “tags”. A few examples:
- when a memory region is freed, it is poisoned again with KASAN_SLAB_FREE
- when redzones around a valid region are poisoned, the corresponding shadow memory areas receive the KASAN_SLAB_REDZONE tag
Those values are pretty important, because this is how KASAN, when it will detect an invalid access, will be able to give details about the fault.
Another important concept here is about those “redzones”: in order to correctly catch out-of-bounds accesses, we must make sure that the memory immediately after an allocation has its shadow memory marked as “inaccessible”, so that KASAN check is sure to get a tag that will trigger a report if an access eventually overflow after the valid region. Let’s illustrate this with an example on our running kernel, by observing some shadow memory bytes under GDB! We can run our kernel again with vng, but this time we will also ask the tool to start a GDB server, which will be listening on port 1234 by default:
$ vng --user root --debug
From another console on our host, we can then start and connect a GDB client (making sure to start it from our kernel sources directory):
$ gdb vmlinux
(gdb) target remote localhost:1234
We now have full control of our kernel under GDB. Before allowing it to resume its execution, we will set a breakpoint in a place allocating some memory and that’s both easy to monitor and to trigger. One such place is proc_self_get_link: this one is called when a user tries to access /proc/self, and so resolves the correct path in procfs for the task accessing this directory. It performs a small allocation (11 bytes) to write the PID of the accessing task in a string. Let’s try to monitor the corresponding shadow bytes! From the GDB console, we can set a breakpoint on this function, and resume our kernel execution:
(gdb) break proc_self_get_link
(gdb) continue
Now that the kernel is running again, from the console in which we have started it through vng, let’s try to access /proc/self:
$ cat /proc/self/status
The kernel will stop on our breakpoint. In the GDB console, we will execute a few next commands (or n for short) to land just right after the allocation. From there, we can:
- print the address returned by kmalloc
- compute the address of the corresponding shadow memory region
- dump the shadow memory region, making sure to print a few bytes before and after
(gdb) next 5
(gdb) print name
$1 = 0xffff88800959a940 ""
(gdb) print $shadow = ((unsigned long long)name >> 3) + 0xdffffc0000000000
$2 = 18446723251727709480
(gdb) x/4bx $shadow-1
0xffffed10012b3527: 0xfc 0x00 0x03 0xfc
Allocating an 11 bytes object in the kernel with kmalloc will make the kernel pull a 16-bytes object from SLAB. Here we chose to dump one shadow memory byte before the allocated memory, and one after. Based on the discussions above, we see that the kernel has performed the expected poisoning on our memory:
- the first granule is entirely unpoisoned (8 bytes), effectively setting the corresponding shadow memory to
0x00 - the second one is partially unpoisoned (3 bytes) to cover the missing bytes, actually making the covered zone 11 bytes large. This sets the second shadow memory byte to
0x03 - the third one is finally poisoned with
KASAN_SLAB_REDZONE(0xfc) to set a redzone right after the granule.

We now know more precisely how the kernel is updating the memory tracking each time we allocate/deallocate some memory, but we are still missing one important part: something must try to read those shadow bytes to evaluate whether an access is correct! This is where the build time instrumentation comes into play.
Instrumenting memory accesses
All of this shadow memory management only makes sense if something is actually checking it. The functions in charge of checking the shadow memory are also parts of the kernel, and are split into two categories:
- helpers checking read accesses:
__asan_load1,__asan_load2,__asan_load4,__asan_load8,__asan_load16and__asan_loadN - helpers checking write accesses:
__asan_store1,__asan_store2,__asan_store4,__asan_store8,__asan_store16and__asan_storeN
All those functions (except the two “generic” variants ending in N) are generated from the DEFINE_ASAN_LOAD_STORE macro, and end up calling check_region_inline, where we can spot shadow bytes checks performed by memory_is_poisoned. However, the kernel does not add itself all those calls in front of each memory access depending on KASAN being enabled or not, actually we will not find any call to those function in the kernel source code. That’s because the task of adding those calls is offloaded to the compiler: if we take a look at scripts/Makefile.kasan we will see that we provide a few more parameters to the compiler when KASAN is enabled, and that those parameters are different depending on the KASAN configuration we have selected. The makefile indeed builds a list of parameters in CFLAGS_KASAN, that are wrapped in _c_flags, then c_flags, and finally passed to the main build command, quiet_cmd_cc_o_c. There are multiple different parameters being passed, the most notable being -fsanitize=kernel-address: this is the one enabling the whole feature. Other parameters are rather about configuring the instrumentation, like defining the address of the shadow memory. We can actually witness the impact of KASAN configuration by dumping the generated instructions for the proc_self_get_link function we have been studying earlier: it contains plenty of memory accesses, and so enabling KASAN makes the kernel embed many checks in it. We can start by building a kernel without KASAN support and try to identify one memory access:
$ objdump --disassemble=proc_self_get_link vmlinux

vmlinux: file format elf64-x86-64

Disassembly of section .text:

ffffffff817c1520 <proc_self_get_link>:
ffffffff817c1520: f3 0f 1e fa endbr64
ffffffff817c1524: e8 e7 03 bd ff call ffffffff81391910 <__fentry__>
ffffffff817c1529: 48 83 ec 20 sub $0x20,%rsp
ffffffff817c152d: 48 89 1c 24 mov %rbx,(%rsp)
ffffffff817c1531: 48 c7 c3 fe ff ff ff mov $0xfffffffffffffffe,%rbx
ffffffff817c1538: 4c 89 64 24 10 mov %r12,0x10(%rsp)
ffffffff817c153d: 49 89 d4 mov %rdx,%r12
ffffffff817c1540: 4c 89 6c 24 18 mov %r13,0x18(%rsp)
ffffffff817c1545: 48 8b 46 28 mov 0x28(%rsi),%rax
[...]
If we take a look at the source code next to this dump, we will recognize a part of the very first line of the proc_self_get_link function when it dereferences the inode argument to get the i_sb field: this is the mov 0x28(%rsi),%rax instruction. This can be confirmed by observing that we are manipulating %rsi, which contains, when entering a function, the second argument passed to it (see SystemV ABI, figure 3.4: “Register usage”), which in our case is a pointer on a struct inode. We can also validate that this 0x28 value is indeed the offset of the i_sb field inside struct inode:
$ gdb vmlinux
(gdb) ptype/ox struct inode
/* offset | size */ type = struct inode {
/* 0x0000 | 0x0002 */ umode_t i_mode;
/* 0x0002 | 0x0002 */ unsigned short i_opflags;
/* 0x0004 | 0x0004 */ unsigned int i_flags;
/* 0x0008 | 0x0008 */ struct posix_acl *i_acl;
/* 0x0010 | 0x0008 */ struct posix_acl *i_default_acl;
/* 0x0018 | 0x0004 */ kuid_t i_uid;
/* 0x001c | 0x0004 */ kgid_t i_gid;
/* 0x0020 | 0x0008 */ const struct inode_operations *i_op;
/* 0x0028 | 0x0008 */ struct super_block *i_sb;
[...]
Now that we have identified at least one memory access in our function, let’s observe the modifications brought to it by the compiler, and more specifically by the outline variant of KASAN. We can update our kernel configuration to enable CONFIG_KASAN and CONFIG_KASAN_OUTLINE, rebuild it, and dump the function again:
$ make menuconfig # Enable outline KASAN
$ vng -b
$ objdump --disassemble=proc_self_get_link vmlinux
[...]
ffffffff81aa7a99: 48 83 ec 20 sub $0x20,%rsp
ffffffff81aa7a9d: 48 89 1c 24 mov %rbx,(%rsp)
ffffffff81aa7aa1: 48 89 f3 mov %rsi,%rbx
ffffffff81aa7aa4: 4c 89 64 24 10 mov %r12,0x10(%rsp)
ffffffff81aa7aa9: 49 89 fc mov %rdi,%r12
ffffffff81aa7aac: 48 8d 7e 28 lea 0x28(%rsi),%rdi
ffffffff81aa7ab0: 48 89 6c 24 08 mov %rbp,0x8(%rsp)
ffffffff81aa7ab5: 48 89 d5 mov %rdx,%rbp
ffffffff81aa7ab8: e8 23 4c eb ff call ffffffff8195c6e0 <__asan_load8>
ffffffff81aa7abd: 48 8b 5b 28 mov 0x28(%rbx),%rbx
We can still find our memory access, even though the compiler has emitted a slightly different instruction (mov 0x28(%rbx),%rbx), but there are a few additional things happening before it: we see that we first load the address we try to access in %rdi (lea 0x28(%rsi),%rdi), in order to pass it to __asan_load8 (call ffffffff8195c6e0 <__asan_load8>). We do not generate a lot more instructions: we only need to prepare the only argument fed to __asan_load8by storing it in %rdi, as stated by SystemV ABI), and to call the helper, but that still generates a lot of new function calls. If we are concerned by the performance impact at runtime and can afford a bigger kernel image, one solution to mitigate this issue is to rather use KASAN in inline mode. Let’s rebuild our kernel with it and check the function again:
$ make menuconfig # Enable inline KASAN
$ vng -b
$ objdump --disassemble=proc_self_get_link vmlinux
[...]
ffffffff82228cb9: 48 b8 00 00 00 00 00 movabs $0xdffffc0000000000,%rax
ffffffff82228cc0: fc ff df
ffffffff82228cc3: 41 55 push %r13
ffffffff82228cc5: 41 54 push %r12
ffffffff82228cc7: 49 89 fc mov %rdi,%r12
ffffffff82228cca: 48 8d 7e 28 lea 0x28(%rsi),%rdi
ffffffff82228cce: 55 push %rbp
ffffffff82228ccf: 48 89 d5 mov %rdx,%rbp
ffffffff82228cd2: 48 89 fa mov %rdi,%rdx
ffffffff82228cd5: 53 push %rbx
ffffffff82228cd6: 48 c1 ea 03 shr $0x3,%rdx
ffffffff82228cda: 48 83 ec 08 sub $0x8,%rsp
ffffffff82228cde: 80 3c 02 00 cmpb $0x0,(%rdx,%rax,1)
ffffffff82228ce2: 0f 85 52 01 00 00 jne ffffffff82228e3a   <proc_self_get_link+0x18a>
ffffffff82228ce8: 48 b8 00 00 00 00 00 movabs $0xdffffc0000000000,%rax
ffffffff82228cef: fc ff df
ffffffff82228cf2: 48 8b 5e 28 mov 0x28(%rsi),%rbx
[...]
ffffffff82228e3a: 48 89 34 24 mov %rsi,(%rsp)
ffffffff82228e3e: e8 bd 37 da ff call ffffffff81fcc600 <__asan_report_load8_noabort>
We have a few more instructions, but we managed to get rid of the callinstruction. Taking a more careful look at the new instructions, we will recognize parts of the KASAN algorithm inlined in our function!
movabs $0xdffffc0000000000,%rax: we loadKASAN_SHADOW_OFFSETin%raxshr $0x3,%rdx: we right shift the target address byKASAN_SHADOW_SCALE_SHIFTcmpb $0x0,(%rdx,%rax,1): we addKASAN_SHADOW_OFFSETand compare the value pointed by the resulting address (now pointing to shadow memory) to0x00to evaluate the memory access
This algorithm already exposes a certain level of optimization: rather than checking specifically the individual bit(s) in shadow memory for the target address, we first check if the whole granule byte is zero: this is a “fast path” check, as a lot of accesses will involve fully unpoisoned granules. If this “fast path” check fails, we end up actually checking the specific bits in a “slow path”. The dump above is a slight exception though: for an 8 bytes access, the whole shadow byte must be zero, or it is a faulty access, hence the call to __asan_report_load8_noabort if the shadow byte is non-zero.
Going further
Even if we managed to cover the general architecture and mechanisms involved in KASAN, we are still missing a few important pieces. Covering exhaustively all aspects of KASAN would deserve more than a blog post, but for readers enjoying reading and learning internals, here are a few leads about where to look at to go further:
- we have only covered memory dynamically allocated at runtime, but there are plenty of other memory types and variables that deserve access validation:
- by default, vmalloc memory is not covered by KASAN. This can be enabled through CONFIG_KASAN_VMALLOC though, at the cost of a greater memory consumption
- global variables are monitored too, despite not being dynamically allocated; the compiler will fill an array describing all the global variables, and emit a call to __asan_register_globals with that array. At runtime, the kernel will take care of unpoisoning those global variables and setting redzones after them
- stack memory can be monitored too: when enabling CONFIG_KASAN_STACK, the kernel Makefiles will add asan-stack=1, making the compiler modify quite a lot the variables passed on stack usage: it will make sure to leave space between them to insert redzones, and it will emit a pair of prologue and epilogue for each function to emit instructions to poison/unpoison all those redzones.
- correctly monitoring memory to detect use-after-free accesses involves some other mechanisms such as quarantine: when
kfreeis called, objects are not returned immediately to SLAB, they are rather put into KASAN quarantine, and really freed later, this allows preventing false-negatives due to the memory possibly being reused immediately for another allocation. - Finally, everything we have covered so far was only about generic KASAN implementation: as mentioned earlier, there are also software tag based and hardware tag based instrumentation available if the target architecture supports it (only ARM64 supports those so far). Those variants allow reducing KASAN’s pressure on memory, as it will need less memory for the tracking.
Those last points bring this post to its conclusion: while knowing all those details about KASAN internals is not strictly needed when we, as kernel developers, want to develop and debug our code, they surely help us understand what we can expect from the tooling, where the limitations are, and how much overhead we are adding on the system when enabling this instrumentation. And for readers who want to go even further, we warmly recommend Sanitizing the Linux kernel – On KASAN and other Dynamic Bug-Finding Tools from Andrey Konovalov (Linux Security Summit, 2022), which digs into KASAN aspects well further.

Alexis wow! The attention to detail and the effort behind this article are clearly visible. Probably not all the readers will react to this but rest assured we really appreciate this. Thank you for this!