This blog post is the second installment in our eBPF blog post series, following our blog post about eBPF selftests.
As eBP F is more and more used in the industry, eBPF kernel developers give considerable attention to eBPF performance: some standard use cases like system monitoring involve hundreds of eBPF programs attached to events triggered at high frequencies. It is then paramount to keep eBPF programs execution overhead as low as possible. This blog post aims to shed some light on an internal eBPF mechanism perfectly showcasing those efforts: the eBPF trampoline.
eBPF tracing programs
eBPF tracing programs regroup a whole variety of eBPF programs aiming to allow users to monitor the kernel execution and internals, making it a very important category for monitoring and security tools. There are multiple program types falling in this category, defining the events triggering the programs execution: kprobe programs (allowing to hook virtually anywhere in the kernel), tracepoint programs and raw tracepoint programs (targeting defined tracepoint instrumented in the kernel source code), perf event programs (targeting software and hardware perf events), pure tracing programs, etc. This last category can be hooked to different attach types:
- fentry programs allow to hook a program at the beginning of a kernel function, allowing for example to record the function arguments
- fexit programs allow to hook a program at the end of a kernel function, allowing for example to record the function return value
- modify return programs go even further and allow to “bypass” kernel functions and replace those with a custom return value.
- iterator programs allow to quickly iterate over a family of kernel objects (eg: all the task_structs), skipping the cost of crossing the kernel-userspace boundary to get data about each of those items.
To get a basic example of such a program, let’s assume that we want to know about any attempt to open a file on our system. We can develop a small monitoring tool fulfilling this need by hooking an eBPF program to the openat2 system call entry, and retrieve the passed path argument each time the syscall is executed:
#include <linux/bpf.h>
#include <bpf/bpf_helpers.h>
#include <bpf/bpf_tracing.h>

SEC("fentry/do_sys_openat2")
int BPF_PROG(trace_files, int dfd, const char *filename, void *how)
{
    int pid = bpf_get_current_pid_tgid() & 0xFFFFFFFF;
    char fmt[] = "Process %d tried to open file %s";

    bpf_trace_printk(fmt, sizeof(fmt), pid, filename);

    return 0;
}

char _license[] SEC("license") = "GPL";
We can then compile and insert this program into the kernel:
$ clang -target bpf -g -O2 -c trace_openat2.c -o trace_openat2.o

$ bpftool prog loadall trace_openat2.o /sys/fs/bpf/trace_openat2 autoattach
This small program will then let us know through the ftrace buffer about any attempt to open a file on the system:
$ bpftool prog trace
gnome-shell-1606 [008] ...11 27519.973179: bpf_trace_printk: Process 1606 tried to open file /sys/class/net/docker0/statistics/rx_errors
gnome-shell-1606 [008] ...11 27519.973197: bpf_trace_printk: Process 1606 tried to open file /sys/class/net/docker0/statistics/tx_errors
gnome-shell-1606 [008] ...11 27519.973216: bpf_trace_printk: Process 1606 tried to open file /sys/class/net/docker0/statistics/collisions
gnome-shell-1606 [008] ...11 27519.973403: bpf_trace_printk: Process 1606 tried to open file /proc/net/dev
gnome-shell-1606 [008] ...11 27519.973492: bpf_trace_printk: Process 1606 tried to open file /sys/class/net/lo/statistics/rx_packets
gnome-shell-1606 [008] ...11 27519.973517: bpf_trace_printk: Process 1606 tried to open file /sys/class/net/lo/statistics/tx_packets
gnome-shell-1606 [008] ...11 27519.973532: bpf_trace_printk: Process 1606 tried to open file /sys/class/net/lo/statistics/rx_bytes
gnome-shell-1606 [008] ...11 27519.973547: bpf_trace_printk: Process 1606 tried to open file /sys/class/net/lo/statistics/tx_bytes
gnome-shell-1606 [008] ...11 27519.973562: bpf_trace_printk: Process 1606 tried to open file /sys/class/net/lo/statistics/rx_errors
gnome-shell-1606 [008] ...11 27519.973577: bpf_trace_printk: Process 1606 tried to open file /sys/class/net/lo/statistics/tx_errors
gnome-shell-1606 [008] ...11 27519.973591: bpf_trace_printk: Process 1606 tried to open file /sys/class/net/lo/statistics/collisions
[...]
With a few lines of C and thanks to the bpf tooling developed and maintained by the eBPF community, we managed to very quickly write an eBPF-based monitor. But how does the kernel manage to call our tracing program each time this openat2 path is executed ?
Calling eBPF tracing programs: the original way
One of the oldest tracing program type implemented in the kernel is the kprobe program: this one allows to hook a program on almost any kernel instruction. Attaching a kprobe eBPF program is in fact a two-steps process: first we need to create and hook a kprobe on the target instruction, and then we hook the eBPF program onto the probe. How does the kernel “register” a kprobe on a specific instruction ? The trick to do so is pretty similar to what happens when we insert breakpoints from a debugger while debugging some software: the kernel patches itself to replace the target instruction by a specific instruction generating a debug exception. The chosen instruction depends of course on the architecture: for example for ARM64, the target instruction is patched with the BRK instruction to generate such a debug exception. We can then have a specific handler to be called by the exception handler that will be triggered once this patched instruction is executed:
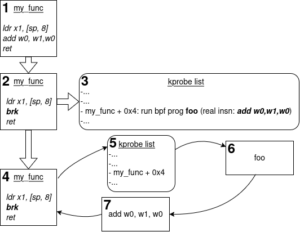 On the diagram above, we can see the whole process of attaching and running kprobes programs:
- we have a kernel function called “my_func” on which we want to attach a program
- we first register a kprobe by patching the target instruction with a BRK instruction
- the kernel maintains a list of registered kprobes, and for each, it remembers about the original instruction
- when the kernel eventually runs the patched function, an exception will be generated
- in the corresponding handler, we check if the exception is due to a kprobe, and if so, we execute all the relevant sub-handlers. If an eBPF program is attached to the kprobe, it is executed as well
- The kprobe preserves the original kernel function behavior: the original instruction is still executed
- Finally, normal execution is resumed.
When an eBPF program is attached to a kprobe, it will receive a structure representing the CPU registers as context: it is then up to the eBPF program to make sense out of those registers.
While this mechanism works well, it has one important downside, which could be critical depending on the use case: as the patched instruction generates an exception, the kernel may have to deal with a lot of context switches and exception handling. It may not be a big deal when our kprobe/eBPF couple is not triggered so often, but if we hook multiple programs on some frequently called functions, this mechanism will start generating a significant overhead. Could there be some alternatives to allow calling into eBPF programs with less overhead ? There is actually one that has been implemented in the kernel to fulfill this need: the eBPF trampoline !
A faster way of executing programs: the eBPF trampoline
The overall concept, on the surface, is pretty simple: what if, instead of triggering an exception to enter our eBPF program, we just “call” it, as we would do if one kernel function called another ?
In fact, calling an eBPF program is not as straightforward as calling another kernel function: those programs are not compiled into native instructions (e.g. x86, ARM64, PowerPC, etc), but into eBPF instructions, which cannot be executed directly by the target platform CPU. One could argue that most of the platforms running eBPF programs likely have some automatic JIT compilation enabled, turning eBPF instructions into native instructions right after the program has been validated by the verifier. Still, this is not enough: there is a calling convention defining how eBPF programs should be called, how they expect to receive arguments, and how they return results. So we need an intermediate layer to allow the kernel to call eBPF programs, while feeding them with the relevant data as input (for example for tracing programs: the arguments consumed by the hooked function). This layer acts as a kind of “ABI bridge”, between the native architecture and eBPF ISA:
The software trampoline is not a mechanism that has emerged with eBPF: this is for example heavily used by ftrace. The trick is to enable the -pg profiling option when compiling the kernel, which will insert a call to the mcount function at the beginning of each function. But to get rid of the resulting overhead when we are not actually tracing any of those functions, those call sites are replaced at build time by some NOP instructions. You can see those NOP instructions if you disassemble the kernel code:
$ aarch64-linux-gdb vmlinux
[...]
(gdb) disas do_sys_openat2
Dump of assembler code for function do_sys_openat2:
  0xffff800080428cd8 <+0>: nop
  0xffff800080428cdc <+4>: nop
  0xffff800080428ce0 <+8>: paciasp
  0xffff800080428ce4 <+12>: stp x29, x30, [sp, #-96]!
  0xffff800080428ce8 <+16>: mrs x3, sp_el0
  0xffff800080428cec <+20>: mov x29, sp
  0xffff800080428cf0 <+24>: stp x19, x20, [sp, #16]
  0xffff800080428cf4 <+28>: mov x20, x1
  0xffff800080428cf8 <+32>: add x1, sp, #0x44
[...]
These NOP instructions are then patched again at runtime when we need to enable tracing on some functions:
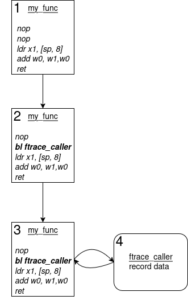
On the diagram above, we observe the following:
- The target function now embeds a few NOP instructions at its beginning
- When enabling tracing on this function, the kernel patches the NOP instructions to a ftrace handler call.
- When the function is executed by the kernel, it will call the corresponding ftrace handler, which will record the needed data, and then jump back to the original function
How can we transpose this mechanism to call eBPF programs rather than a ftrace handlers ? There are multiple challenges with this:
- we want to call a program that has been inserted at runtime, rather than a handler that has been built into the kernel, so we do not know in advance its address or interface
- we need to respect a specific calling convention when jumping into the program
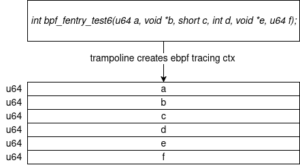
On this second point, the kind of program that we are interested in, the tracing programs, expects to receive the arguments passed to the target function they are attached to, through a “tracing context”. This context is an array of contiguous u64 values:
To fulfill those constraints, the kernel then needs to dynamically generate a trampoline for each function we want to hook an eBPF program on. Each trampoline will be different, as they have different kinds of arguments to record and pass to the attached program. And since those are generated at runtime, those dynamically created trampolines are written with machine instructions. The code for each generated trampoline is stored in a table in the eBPF subsystem. From there, we can distinguish multiple cases: let’s start with a simple one, which consists in attaching a program at the entry of a function: that is the role of the fentry program type, allowing users to retrieve the arguments passed to a function.
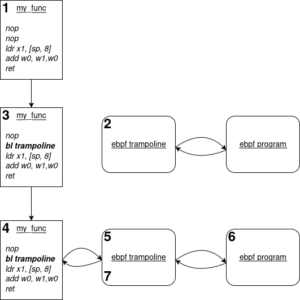 We can observe the following steps:
- our kernel target function is built with a few NOP instructions at its entry
- when hooking an eBPF program to it, the kernel starts by generating the corresponding trampoline
- if it succeeds, it patches a NOP instruction with a call to the address of the generated trampoline.
- when the corresponding function is executed, the trampoline is called.
- The trampoline prepares the program execution (see below) and then calls the program.
- Our program starts executing. It has received the function arguments as input context.
- Once the program has executed, it returns to the trampoline. The trampoline then returns to the original function.
Preparing the program context and execution involves many low level operations: each architecture supported by the kernel then needs to implement its own trampoline generator in order to be able to execute tracing programs. If we follow the trampoline generator code for ARM64, we can spot the first important steps (voluntarily ignoring some details that will be covered later), and the resulting instructions that are generated in the trampoline code:
- the kernel first computes the space needed to allocate the trampoline custom stack, and then reserves it
- it saves the number of registers arguments consumed by the target function (this values is for example needed by the bpf_get_func_arg_cnt bpf helper used in BPF programs)
- next it saves the function arguments on the trampoline stack: those saved arguments forms the program that will be passed to the context
- then it calls the attached eBPF program
- before returning to the target function, the trampoline makes sure to restore the function arguments into the relevant registers, as those values are overwritten when the eBPF program executes.
- finally the trampoline returns to the target function
This makes the attachment step more complex than for kprobes programs, and unfortunately, we lose the capacity to hook anywhere in the function, we can hook only at the very beginning of it. But that still covers the majority of the use cases for tracing programs, and it comes with the major benefit of a way lower overhead when triggering those programs.
Advanced use case: instrumenting both entry and exit
The truth is, we have only covered a tiny part of the bpf trampoline mechanism. The trampoline is far more complex, because it is able to handle more use cases than mere fentry programs. For example, what if we want to capture the return value from a function, rather than the arguments ? Or what if I want to capture both ? We have the fexit program type for such a purpose, but implementing it is not straightforward: we cannot just create and attach a trampoline at the end of a function, as the function does not have any NOP instructions at its end !
That’s where the trampoline mechanism is really smart: instead of just catching the function entry and returning to the original function once done, it can completely replace the original execution order to perform itself the whole chain: fentry program – target function – fexit program.
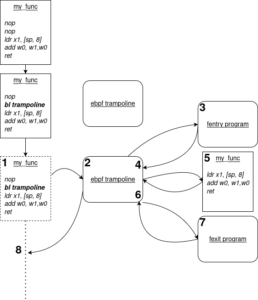 The call sequence is now updated to the following:
- When the target function is called, it jumps immediately to the trampoline
- The trampoline prepares the fentry program execution (eg: gathering the function arguments) and calls it.
- The fentry program executes: it has received the function arguments as an input. It then returns to the trampoline.
- Rather than returning to the original function, the trampoline calls the original function. The main difference is that the target function, once done, will not return to its original parent but… to the trampoline again !
- The target function executes. The trampoline has made sure to pass all the original arguments correctly, so it is clueless about the execution ordering modification.
- The target function returns to the trampoline, which gets its return value. The trampoline prepares once again a tracing context, this time with the recorded return value additionally to the function arguments
- It calls the attached fexit program, which is able to read the target function arguments and return value.
- The fexit program returns to the trampoline, which restores the execution context to make it ready to return to the target function parent, as the target function has already been executed by the trampoline.
If we take a look once again at the ARM64 trampoline generator, we can spot the additional steps and resulting instructions needed to handle this new use case:
- after having executed the fentry program, the trampoline now needs to execute the target function. To do so:
- it restores the original function arguments in the relevant registers
- it then calls the target function
- it saves the return value from the target function
- after the target function execution, it runs the fexit program
This new trampoline version makes the tracing programs even more powerful: despite having run two programs, one at the entry, one at the exit, the target function has been able to run flawlessly, consuming the intended arguments, as if it has been called ordinarily by its original caller. And all of this with a minimal overhead !
The eBPF trampoline support among different architectures
The attentive readers (for those who did not drown in the technical details above !) have understood that the eBPF trampoline implementation involves many architecture-specific details, as it manipulates raw registers and instructions. The direct consequence of this is that any new feature involving a trampoline needs some work on all architectures supporting eBPF tracing programs: otherwise, the new feature remains locked behind an error value while waiting for a proper implementation.
As part of the effort founded by the eBPF Foundation, Bootlin engineer Alexis Lothoré has been tasked with realigning the ARM64 eBPF support level with more “featureful” architectures. x86_64, having been for a long time the default architecture for servers and cloud-based use cases (which is where eBPF comes from), has often been the leading platforms for new eBPF features. ARM64 is gaining traction on those same use cases, and so many companies and users need the most recent eBPF features to be available on this architecture as well.
Bootlin has then worked with the community to properly integrate and enable the missing features on ARM64. Some of those efforts were already undertaken by the community and/or stalled. Our most notable contributions are about the following features:
- enabling the multi-kprobe attach point: this mechanism allows to quickly attach a kprobe to multiple functions (and so, to attach a bpf program to multiple functions) in a single call. This feature has been depending on the work initiated by Masami Hiramatsu to rewrite fprobes (a specific kind of kernel probe on which multi-kprobes depend) on top of the function graph. Most of the feature is then automatically enabled: the main task has been about enabling and running some tests.
- allowing eBPF tracing programs to consume more than 8 arguments. The trampoline versions covered above are simplified regarding target function arguments management: it assumed that all the original target function arguments are passed through registers, but in fact, we have a limited number of registers, and the additional arguments are passed on the stack. This leads to more complexity in the trampoline code, especially since the different architectures and ABIs have different rules and constraints for those arguments on the stack. This work has led to interesting discussions, especially around the corner cases involved in argument passing. Thanks to this update, we can now hook eBPF programs on ARM64 functions consuming more than 8 arguments.
Thanks to the fundings from the eBPF foundation, this work is now integrated, and it has been made available with the recent release of kernel version 6.16.0. If you enjoyed this post, make sure not to miss our next posts about eBPF technology !

